Instrumentation: Commercial Systems and Hardware
Evolution of Commercial Platforms
The transformation of serial block-face scanning electron microscopy (SBF-SEM) from an experimental concept into a mainstream technique for volume electron microscopy was driven by significant advancements in instrumentation and commercial availability. The foundational concept of integrating a miniature ultramicrotome within the vacuum chamber of a scanning electron microscope (SEM) was first proposed and demonstrated by Leighton in 1981 [12, 13, 17, 22, 26, 32, 34]. However, early implementations were hindered by the limitations of contemporary vacuum systems, which required samples to be removed and carbon-coated between each cut to prevent severe charging artifacts, as well as the nascent state of digital image storage [12, 18, 26]. The technique was successfully revitalized more than two decades later by Denk and Horstmann in 2004, who capitalized on advancements in variable-pressure SEM and computer automation to create a robust, fully automated system [12, 13, 17, 18, 20, 22, 26, 32, 34, 37, 74, 87] (Figures 11–13).
Following Denk and Horstmann’s successful proof-of-concept, the technology was commercialized by Gatan, Inc. as the 3View system, which remains one of the most widely adopted platforms in the field [6, 12, 14, 17, 18, 20, 22, 26, 33, 34, 35, 37, 51, 74, 93]. The 3View platform is typically installed by replacing the standard specimen chamber door of a host SEM with a specialized door housing the custom ultramicrotome and associated motors [18, 20, 22, 56]. Over iterative generations, such as the 3View2XP, the system has been integrated into a wide variety of field-emission SEMs (FE-SEMs) manufactured by Zeiss, FEI (now ThermoFisher Scientific), JEOL, and TESCAN [12, 18, 35, 68].
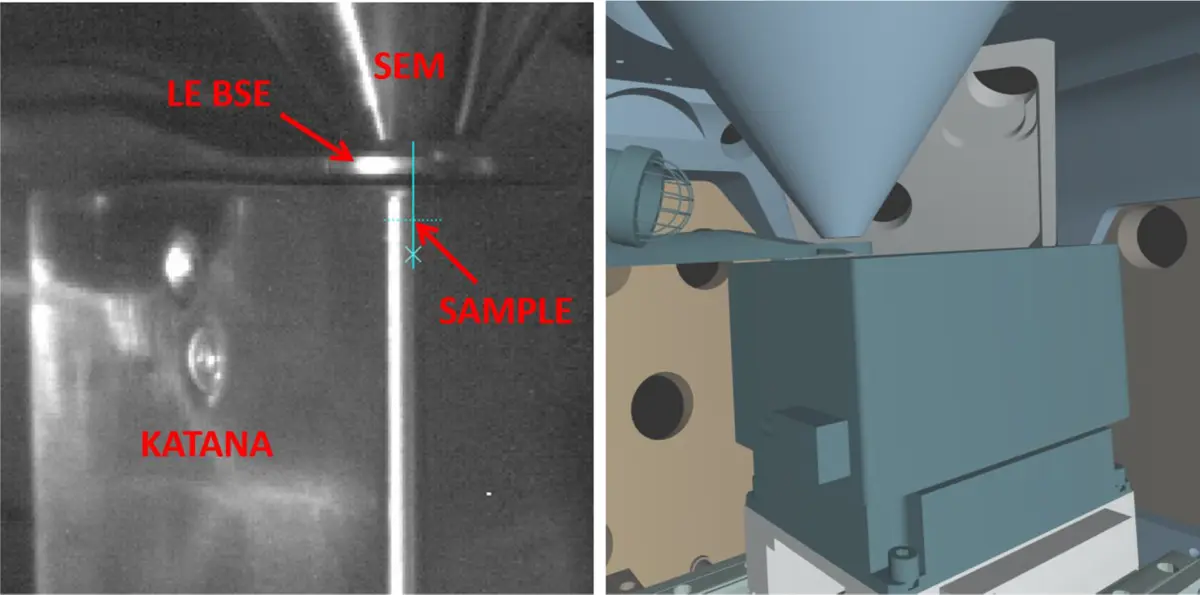
As the demand for volume EM expanded, alternative commercial platforms were developed to address specific workflow bottlenecks. In 2014–2015, FEI (ThermoFisher Scientific) introduced the VolumeScope (initially on the Teneo and later Apreo platforms), which integrated the microtome directly onto the regular SEM stage rather than requiring a dedicated chamber door [1, 17, 18, 20, 22, 51, 98]. More recently, ConnectomX Ltd. introduced the Katana, a highly compact and miniature in-chamber ultramicrotome [18, 19, 22, 90]. The Katana mounts directly onto a standard SEM stage using customized adapters, allowing for superior mechanical stability and rapid installation or removal [19, 22]. This modularity is particularly advantageous in core research facilities, as it prevents the SEM from becoming a narrowly specialized, single-use tool [19].
In-Chamber Ultramicrotomy and System Mechanics
The core hardware of any SBF-SEM system is the in-chamber ultramicrotome, which mechanically removes ultrathin layers from a resin-embedded specimen to expose fresh block faces for iterative imaging [13, 17, 18, 22, 26, 28, 34, 38, 41, 56, 58, 61, 71, 75, 81, 90]. Unlike traditional serial section transmission electron microscopy (ssTEM), where sections must be manually collected on grids—a process prone to section loss, folding, and distortion—SBF-SEM images the stationary block face directly [14, 22, 33, 59, 71, 95]. This ensures that the resulting digital image stacks are inherently aligned, requiring only minimal computational registration [14, 22, 59, 71, 74, 81, 95] (Figure 14).
The microtome relies on a high-precision diamond knife [13, 17, 18, 22, 26, 28, 34, 38, 41, 56, 58, 61, 71, 75, 81, 90]. To ensure alignment and prevent focus drift, the sample is typically advanced upward in the z-direction by a motorized precision mechanism, while the knife sweeps across the fixed focal plane to shave off the surface layer [13, 18]. Most modern SBF-SEM microtomes can routinely cut sections as thin as 25 to 50 nm [11, 25, 38, 41, 42, 56, 75, 82]. For specific optimally prepared specimens—particularly hard engineering materials or densely stained biological tissues—cutting thicknesses down to 10–15 nm have been successfully achieved [25, 38, 56, 93]. To minimize compression artifacts and mechanical damage to the block face during cutting, some systems incorporate an oscillating diamond knife [38, 56, 71, 87]. Lateral oscillation reduces the necessary cutting force, limits friction-induced heat, and provides a smoother block face, which is especially critical when cutting extremely thin slices or heterogeneous materials like alloys [38, 56]. Debris generated by the sectioning process is generally discarded into the chamber or cleared using automated debris-removal mechanisms or compressed air [14, 38, 74, 87].
Signal Generation: Backscattered Electron Detectors
Image formation in SBF-SEM relies almost exclusively on the detection of backscattered electrons (BSEs) [13, 14, 20, 22, 32, 33, 34, 41]. When the primary electron beam interacts with the specimen, it generates both secondary electrons (SEs) and BSEs [20, 22, 51, 75]. Secondary electrons are low-energy particles (<50 eV) that escape only from the extreme surface (the top 1–50 nm) and primarily convey topographical information [20, 22, 51, 75, 79]. Because the block face in SBF-SEM is exceptionally smooth after being cut by the diamond knife, SE imaging yields very low contrast for biological features [13, 51]. Conversely, BSEs are high-energy electrons from the primary beam that have undergone elastic scattering [20, 22, 51, 75]. The yield of BSEs is strongly dependent on the atomic number (Z) of the interacting atoms; thus, structures heavily impregnated with high-Z elements like osmium, uranium, and lead appear bright against the dark background of the low-Z carbon-based embedding resin [13, 14, 22, 32, 41, 51].
Because detecting BSEs efficiently at the low acceleration voltages used in SBF-SEM is challenging, manufacturers have developed specialized hardware. Early implementations relied on monolithic solid-state diode detectors placed directly beneath the objective pole piece [51]. However, standard solid-state detectors often suffer from reduced sensitivity at low landing energies due to their surface passivation layers, which low-energy BSEs cannot easily penetrate [51, 92]. To combat this, dedicated low-energy BSE detectors have been engineered. For instance, the Gatan OnPoint detector features modified diode circuitry and geometry to maximize sensitivity and speed at accelerating voltages below 5 kV [22, 26, 47, 77, 91]. Similarly, the TESCAN SBF-SEM solution utilizes a custom low-energy BSE (LE BSE) detector physically inserted between the SEM column and the Katana microtome with minimal clearance, decreasing the working distance to maximize signal collection and improve spatial resolution [19].
Advanced multi-segment detectors, such as the Concentric Backscatter (CBS) detector offered by FEI/ThermoFisher, provide an additional layer of signal discrimination [51]. The CBS detector consists of multiple annular rings that allow spatial differentiation of the emitted electrons based on their take-off angles [51]. By selectively reading signals from specific rings (e.g., turning off the innermost ring), users can digitally filter out unwanted SE contamination, isolating a pure compositional BSE signal [51].
Acceleration Voltage and Z-Resolution
Optimizing the acceleration voltage is one of the most critical operational parameters in SBF-SEM, as it dictates the delicate balance between lateral (X-Y) resolution, axial (Z) resolution, and image contrast. Most SBF-SEM protocols utilize primary beam energies ranging from 1.0 kV to 3.0 kV [18, 20, 22, 26, 28, 32, 35, 40, 41, 47, 51, 67, 68, 69, 75, 77, 79, 84, 85, 87, 89, 92, 94].
The primary limitation of volumetric resolution in standard SBF-SEM is not the X-Y pixel size—which can easily reach 5 nm or lower [25, 28, 32, 58, 59]—but rather the Z-resolution [19, 25, 32, 56, 75]. Axial resolution is constrained by two main factors: the minimum physical thickness the ultramicrotome can reliably cut without skipping or causing severe block compression, and the penetration depth of the electron beam (the interaction volume) [25, 32, 42, 56, 75]. If a high acceleration voltage (e.g., >3.0 kV) is used, the electron probe penetrates deeply into the resin block [25, 42, 56]. Consequently, the collected BSE signal incorporates information from structures located tens of nanometers beneath the current block face, muddying the Z-resolution and causing "ghosting" of features that have not yet been sectioned [25, 42, 56]. To restrict the interaction volume and ensure that the BSE signal originates almost entirely from the uppermost 10 to 30 nm of the block face, the landing energy must be kept low, ideally between 1.0 and 2.0 keV [32, 42, 51, 56, 79].
However, operating at very low acceleration voltages introduces challenges. The beam current tends to drop, the optical aberrations of the SEM column (such as chromatic aberration) become more pronounced, and the overall BSE yield decreases precipitously, leading to poor signal-to-noise ratios [51, 75, 92]. Furthermore, low beam energies make the sample highly susceptible to radiation damage. At a primary energy of 1.5 keV, the maximum allowable electron fluence before the resin matrix begins to shrink or melt is approximately 20 [32, 42]. Exceeding this dose alters the viscosity of the block, causing the diamond knife to cut erratically and introducing discontinuities in the resulting 3D dataset [32, 42, 51].
Multi-Energy Deconvolution (MED)
To overcome the physical limitations of mechanical sectioning and achieve true isotropic 3D resolution (where Z-resolution equals X-Y resolution), manufacturers have developed computational hardware-software synergies. The ThermoFisher VolumeScope (and earlier Teneo VS platforms) utilizes a technique known as Multi-Energy Deconvolution (MED) to perform "optical sectioning" beneath the block face [18, 20, 25, 29, 42, 98].
MED takes advantage of the predictable relationship between electron landing energy and penetration depth [20, 25, 42]. Instead of taking a single image and then cutting the block, the SEM scans the exact same block face multiple times at incrementally increasing acceleration voltages (e.g., 1.0 kV, 1.4 kV, and 1.8 kV) [25, 42]. At 1.0 kV, the BSE signal reflects only the superficial 10–15 nm layer [25, 42]. At 1.4 kV, the beam penetrates deeper, and the resulting image represents a mixture of the top layer and the underlying 15–30 nm layer [25, 42]. By applying a linear deconvolution matrix or blind deconvolution algorithms (such as the ThruSight software) based on Monte Carlo simulations of electron scattering, the system mathematically subtracts the overlapping signals [20, 25, 42]. This yields several distinct, virtually reconstructed "sub-slices" for every physical cut [25, 42]. Through MED, researchers can physically slice the block at a reliable 25–50 nm thickness while obtaining a final dataset with a Z-resolution of 10 nm or better, effectively bridging the gap between mechanical sectioning and high-resolution electron tomography [25, 42].
Beam Deceleration and Stage Biasing
An advanced hardware configuration utilized to improve both signal collection and Z-resolution involves applying a negative bias potential to the sample stage, a technique known as beam deceleration [51]. Adapted from low-energy electron microscopy (LEEM) principles [51], beam deceleration allows the SEM column to operate at a relatively high acceleration voltage—which maintains a tight, high-current probe and minimizes chromatic aberration—while forcing the electrons to slow down just before striking the sample [51].
In practice, an SEM might be set to a gun acceleration voltage of 3.0 kV, while a precise high-voltage power supply applies a -1.5 kV potential to the sample stage [51]. The resulting landing energy of the primary beam is the difference between the two: 1.5 keV [51]. This reduced landing energy successfully restricts the beam penetration depth to less than 30 nm, ensuring high Z-resolution [51].
Simultaneously, the negative electric field at the sample surface acts as an electrostatic lens for the emitted BSEs [51]. As the backscattered electrons leave the sample, they are repelled by the stage bias and forcefully re-accelerated up the SEM column toward the objective pole piece where the detector is located [51]. An electron that leaves the sample at 1.5 keV will strike the detector at nearly 3.0 keV [51]. Because solid-state diode detectors are exponentially more sensitive to high-energy impacts, this re-acceleration produces a massive boost in the signal-to-noise ratio—often increasing the detected signal by up to 20-fold compared to conventional SBF-SEM at the same landing energy [51]. This extraordinary signal gain allows operators to use much lower electron doses, significantly reducing radiation damage to the resin block and facilitating faster scan rates [51].
A critical complication of stage biasing is that the electrostatic field also captures and highly accelerates low-energy SEs [51]. If these SEs are allowed to strike the detector, they introduce severe charging artifacts and topographical noise that overwhelm the compositional Z-contrast of the BSEs [51]. Therefore, implementing beam deceleration necessitates specialized detector hardware to separate the trajectories of SEs and BSEs [51]. Because the electric field tends to collimate the low-energy SEs tightly down the center axis of the column while high-energy BSEs scatter at wider angles, operators can reject SEs either by turning off the inner rings of a Concentric Backscatter (CBS) detector or by physically installing a custom central blocking aperture over a monolithic BSE detector [51].
Charge Mitigation: Variable Pressure and Focal Charge Compensation
One of the most persistent instrumentation challenges in SBF-SEM is the mitigation of electrostatic charging. Because biological samples must be heavily stained with metals and embedded in inherently non-conductive epoxy or acrylic resins, the un-grounded regions of the block rapidly accumulate negative charge under the electron beam [13, 14, 20, 26, 29, 32, 42, 59, 86]. Charge buildup deflects the primary beam, leading to severe image jitter, focal drift, physical distortion of the data stack, and even catastrophic sample damage [13, 14, 29, 42, 74, 86].
To combat this, the majority of SBF-SEM systems feature a Variable Pressure (VP) or low-vacuum operating mode [12, 13, 14, 15, 20, 26, 29, 32, 35, 42, 47, 58, 65, 69, 87, 88, 94, 96, 98]. In VP mode, a controlled amount of gas—typically water vapor or nitrogen—is introduced into the specimen chamber to maintain a pressure between 10 and 50 Pa [13, 35, 42, 65, 69, 84, 96]. As the primary electron beam travels through this gaseous environment, it collides with gas molecules, producing positively charged gas ions [13]. These ions naturally cascade down to the negatively charged specimen surface, effectively neutralizing the block face in real-time [13].
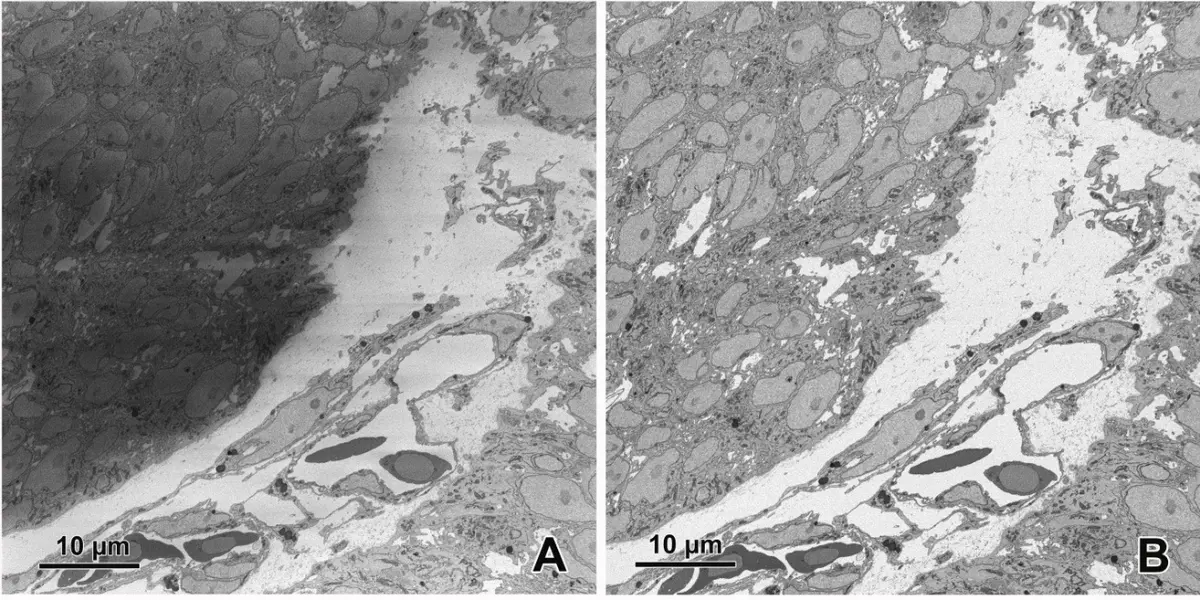
While the residual-gas method successfully eliminates charging artifacts and allows the imaging of sparsely stained or highly insulative samples without the need for inter-slice metal coating, it comes with a severe tradeoff in imaging performance [14, 29, 32, 42]. The collisions between the electron beam and the chamber gas cause beam "skirting" or broadening [29, 32, 42]. This scattering reduces the number of electrons concentrated in the primary focal spot, diminishing both lateral spatial resolution and the overall signal-to-noise ratio [14, 29, 32, 42]. Consequently, for optimally stained and well-grounded specimens (e.g., lipid-rich nervous tissue), operating in high-vacuum mode is always preferable, as it permits faster acquisition at lower dwell times and yields significantly sharper ultrastructural detail [13, 14, 32, 35, 41, 67, 79, 93, 97].
To merge the benefits of charge neutralization with the high-resolution capabilities of high-vacuum operation, recent hardware innovations have introduced Focal Charge Compensation (FCC) [26, 32, 42, 97]. Instead of flooding the entire SEM chamber with gas, an FCC system employs a precisely aligned, retractable capillary needle positioned just fractions of a millimeter above the block face [26, 32, 42, 97]. During imaging, the needle locally injects a minute stream of nitrogen gas directly over the region being scanned [26, 32, 42]. This focal injection creates a dense micro-environment of gas sufficient to provide complete charge neutralization via beam ionization, while the bulk of the SEM chamber remains at a high vacuum [26, 32, 42]. By confining the gas to the immediate vicinity of the sample, the electron beam travels unscattered through the column for the vast majority of its path, effectively eliminating beam broadening and preserving the pristine spatial resolution inherent to high-vacuum SBF-SEM [26, 32, 42, 97].