Cell Biology and Organelle Studies
Three-Dimensional Mapping of Subcellular Architecture
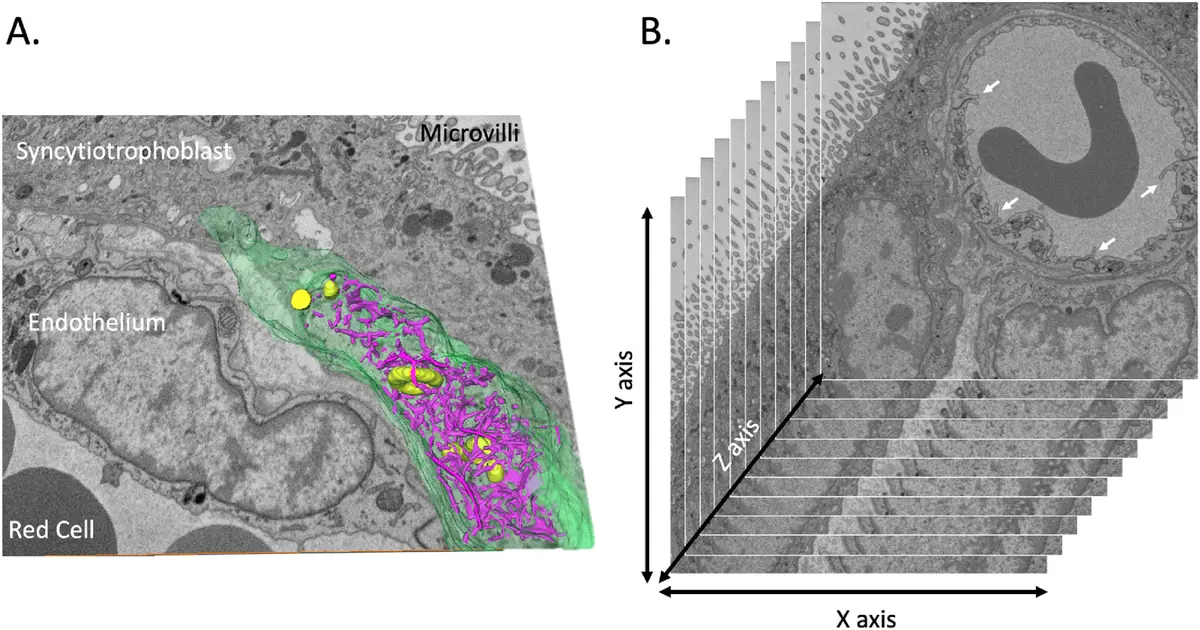
The structural complexity of eukaryotic cells fundamentally relies on the precise, three-dimensional (3D) spatial organisation of subcellular compartments. While conventional two-dimensional (2D) transmission electron microscopy (TEM) has historically provided high-resolution snapshots of cellular ultrastructure, it is fundamentally limited by the thinness of its optical sections, rendering the volumetric assessment of large, tortuous organelles highly susceptible to sampling bias and misinterpretation [42], [9], [34]. Serial block-face scanning electron microscopy (SBF-SEM) effectively bridges the gap between the targeted nanoscale resolution of electron tomography (ET) and the massive field-of-view offered by optical microscopy [32], [3]. By employing an automated in-chamber ultramicrotome that iteratively removes ultrathin slices (as thin as 25–50 nm) and sequentially images the freshly exposed block face using backscattered electron (BSE) detection, SBF-SEM produces inherently pre-aligned stacks of large-volume tissue data (ranging from to ) [32], [14], [14], [14] (Figures 40–43).
Such expansive imaging volumes, combined with an x-y planar resolution of roughly 5 to 20 nm, empower researchers to contextualise the entire "organellome" of a cell in its native state [32], [14], [150], [42]. The recent integration of advanced artificial intelligence algorithms—such as supervised deep neural networks and transfer learning pipelines—allows for the rapid, automated 3D segmentation of over 30 distinct subcellular structures, accelerating the transition from morphological observation to quantitative, whole-cell organelle morphometry [167], [167], [163].
Mitochondrial Networks and Bioenergetic Topography
Mitochondria are remarkably pleomorphic and dynamic organelles that form elaborate reticular networks traversing the cytoplasm. The ability of SBF-SEM to reconstruct entire cellular volumes has been instrumental in characterizing these complex mitochondrial assemblies across numerous physiological and pathological states. In cardiac and skeletal muscle tissue, for instance, volumetric electron microscopy allows researchers to differentiate and quantify distinct spatial subpopulations, such as perinuclear and interfibrillar mitochondria, shedding light on localized bioenergetic supply mechanisms and intracellular calcium handling [223], [70]. High-resolution block-face imaging of myocardial tissue not only reveals the macro-architecture of these populations but can also provide detail at the level of internal mitochondrial cristae [30]. By mapping cristae topology in 3D, researchers have quantified the ratio of connected versus orphaned cristae networks, mapping significant structural remodeling and functional decoupling during events such as cardiac ischemia-reperfusion injury [224].
Beyond striated muscle, SBF-SEM has dramatically improved the spatial profiling of mitochondria in the central nervous system. Because the extended, filamentous processes of neurons make organelles difficult to trace in 2D, SBF-SEM is crucial for capturing the distinct morphologies and volumetric distribution of somatic versus presynaptic mitochondria [111], [111], [226]. Quantitative SBF-SEM has illuminated developmental increases in presynaptic mitochondrial abundance at the calyx of Held, which correlates with the bioenergetic demands of high-fidelity neurotransmission [226]. Similarly, in murine models of familial Alzheimer's disease, detailed SBF-SEM reconstructions of hippocampal mossy fiber synapses have revealed altered volumetric profiles of local mitochondria, paired with reductions in the area of synaptic contact and coordinated shifts in both "docked" and "readily releasable" synaptic vesicle pools [232].
SBF-SEM is equally valuable for interrogating the genetic and molecular regulation of mitochondrial morphology. Whole-cell SBF-SEM reconstructions of the yeast *Saccharomyces cerevisiae* have been utilized to demonstrate the role of the Cdc48p/p97 ATPase in maintaining normal mitochondrial architecture; cells harboring ATPase-deficient mutations exhibited profound mitochondrial fragmentation and aggregation [49], [49], [49], [49]. In mammalian cells, volumetric segmentation has documented widespread mitochondrial fragmentation in cultured human and murine myotubes following the ablation of the Sam50 protein [227], [227]. In oncology, automated serial-block face imaging of 3D cancer organoids (tumorspheres) and patient-derived xenograft models of triple-negative breast cancer has provided critical quantitative data on how mitochondrial networks dynamically remodel in response to chemotherapeutic agents [90], [39], [61].
Endoplasmic Reticulum and Sarcotubular Complexity
The endoplasmic reticulum (ER) forms a pervasive intracellular network of continuous sheets and highly branched tubules. Understanding its geometric complexity requires high-resolution spatial mapping. Early applications of SBF-SEM, often correlated with parallel electron tomography studies, were instrumental in resolving the intricate 3D structure of the ER, capturing lateral resolutions between 4.7 and 14.3 nm to accurately trace the transitions between sheet and tubular sub-regions within a single cell [14], [14], [14].
In highly specialized cells, SBF-SEM provides unmatched insight into ER adaptations. In cardiac myocytes, the sarcoplasmic reticulum (SR) acts as a specialized functional extension of the ER, responsible for precise calcium storage and release. SBF-SEM enables the complete 3D reconstruction of the SR and its interface with the transverse-tubule (t-tubule) network [100], [24]. This approach offers high-resolution, volumetric data on the spatial organization of the dyads—the highly specialized calcium microdomains where the t-tubules intimately associate with the junctional SR [24], [24], [235]. The morphological precision afforded by SBF-SEM reconstructions allows researchers to build realistic, geometrically accurate computational models of spatio-temporal intracellular calcium fluxes [225], [235].
In plant biology, SBF-SEM has also been transformative for visualising the endomembrane system. Studies on high-pressure frozen plant root meristems have successfully captured the continuous arrays of the cortical ER, distinguishing between cisternal and tubular domains [56], [77], [44]. Furthermore, large-volume 3D reconstructions of the maize endosperm have revealed the ultrastructural biogenesis of zein protein bodies, directly demonstrating their budding from the central regions of continuous ER sheets [234]. SBF-SEM has additionally quantified the distribution of plasmodesmata—complex ER-containing channels traversing plant cell walls—providing essential morphometric data to model molecular transport across tissue boundaries [228], [44], [230].
The Golgi Apparatus and Secretory Organelle Biogenesis
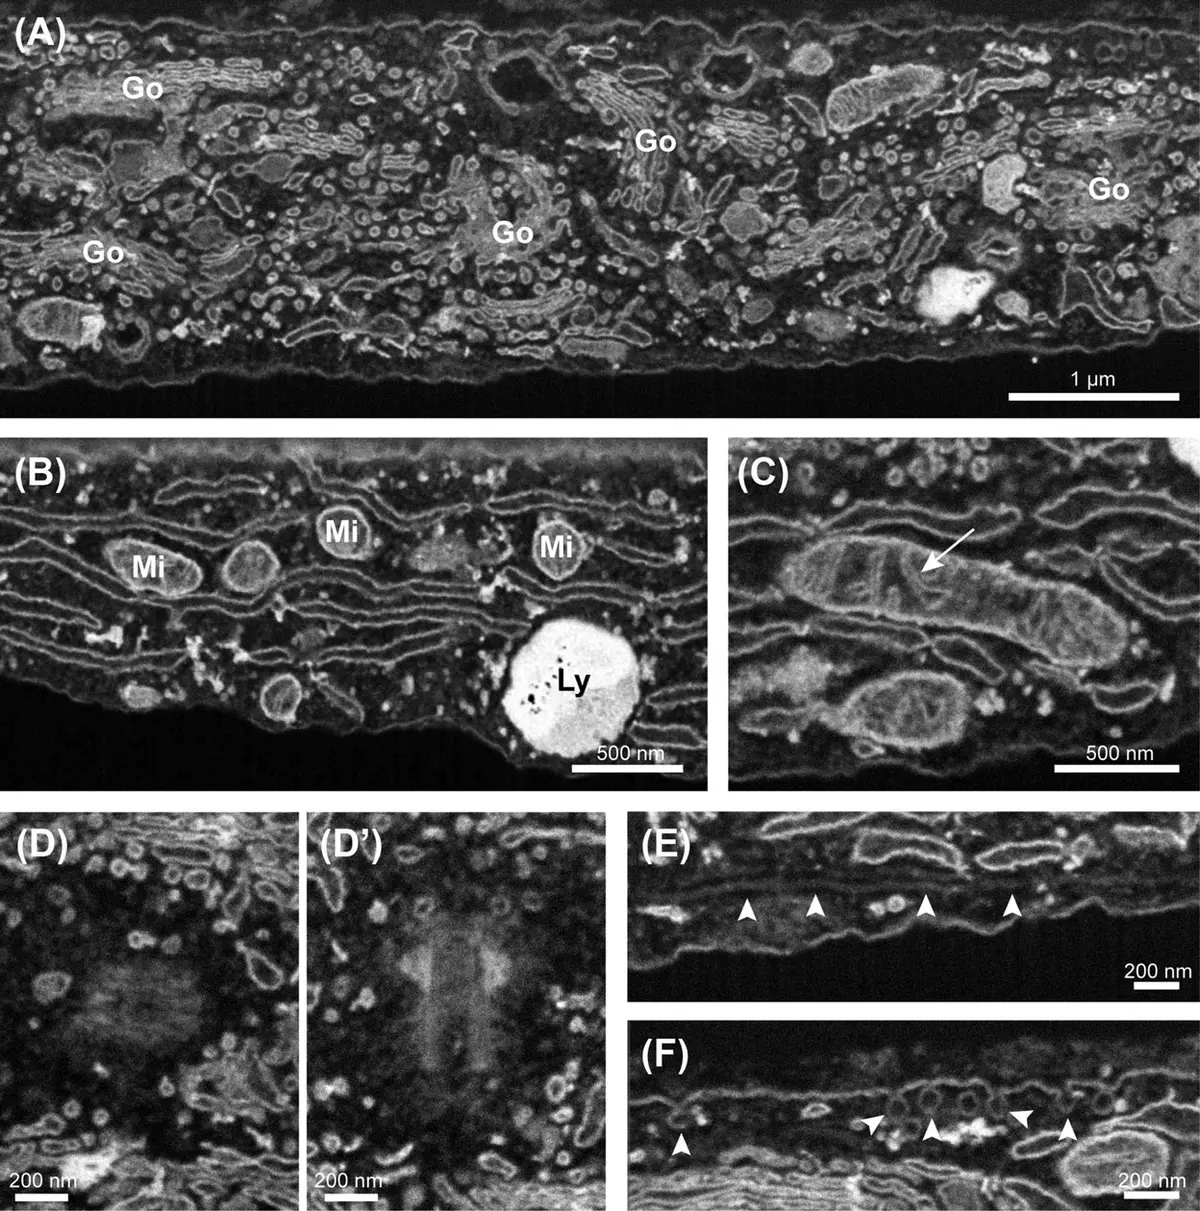
The Golgi apparatus is notoriously difficult to reconstruct in its entirety using traditional TEM due to its expansive, ribbon-like structure that often spans wide, perinuclear territories. In order to enhance membrane contrast for block-face imaging, investigators have refined selective heavy-metal staining protocols. For instance, the application of zinc, iodine, and osmium (ZIO) histochemistry specifically and uniformly impregnates the Golgi lamellae with intense electron density across the entire cis-to-trans axis [154], [154], [154]. This heavy metal deposition bypasses the need for conventional conductive resins or additional anti-charging measures, enabling rapid, semi-automated SBF-SEM thresholding and 3D reconstruction of the Golgi apparatus within whole rat hepatocytes [154], [154], [154]. Volumetric mapping using this protocol has unveiled unprecedented topographic details, revealing that the hepatic Golgi is organized not merely in standard perinuclear clusters, but as a twisted, anastomosing ribbon extensively aligned along the bile canaliculi [154], [154]. Additional studies in neural tissues utilizing complementary techniques, such as osmium maceration and serial section imaging, confirm the remarkable morphological diversity of the Golgi apparatus across different secretory, epithelial, and neuronal cell types [2], [2], [2], [2], [2], [2], [2].
SBF-SEM is also an exemplary tool for visualizing the genesis of specialized secretory organelles. In human umbilical vein endothelial cells, volumetric imaging has captured the spatial organization of the Golgi apparatus alongside the biogenesis of Weibel-Palade bodies (WPBs), the endothelial-specific storage organelles [30], [30]. Comprehensive large-scale reconstructions have revealed that newly forming WPBs densely cluster in close physical association with specific Golgi membrane stacks, providing a structural basis for understanding the spatial constraints of organelle maturation and intracellular trafficking prior to exocytosis [30], [30], [30], [30].
Lysosomal, Endosomal, and Nuclear Compartment Dynamics
SBF-SEM effectively documents the morphological shifts of degradative pathways and the nuclear compartment under diverse physiological constraints. Along the endolysosomal axis, high-resolution volume electron microscopy has successfully resolved the structure of multivesicular endosomes, identifying intralumenal vesicle concatenation events that challenge traditional models of endosomal maturation [228].
The nuclear envelope—often considered a relatively stable double-membrane structure—exhibits remarkable plasticity and fragility under stress, which SBF-SEM captures with exquisite detail. In models of radiation-induced cellular senescence, volumetric reconstructions of entire human fibroblasts have visualized severe structural anomalies of the nucleus [96], [96]. Segmentation of these volumes revealed the presence of deep nucleo-cytoplasmic nanotubes: continuous tunnel-like invaginations containing both inner and outer nuclear membranes that physically penetrate deep into the nuclear interior [96]. Furthermore, SBF-SEM has tracked the precise physical separation of cytoplasmic chromatin fragments (CCFs) as they detach from the senescent nucleus. SBF-SEM data successfully captured the spatial targeting of these isolated chromatin blebs by the cellular autophagy machinery, explicitly visualizing lysosomes—ranging from 0.5 to 1 µm in diameter—fusing with the outer membranes of the detached CCFs [96], [96].
Volumetric EM has likewise been instrumental in studying dynamic nuclear and cytoskeletal shifts during cellular migration. Analyses of migrating neuroblasts within the postnatal brain utilized sequential SBF-SEM imaging to meticulously trace the changing ultrastructure and orientation of the nucleus, Golgi apparatus, and centrioles [155], [155]. The 3D reconstructions provided critical geometric data regarding the position and length of the primary cilium relative to the leading process during somal translocation [155].
Organelle Interactions and Membrane Contact Sites (MCSs)
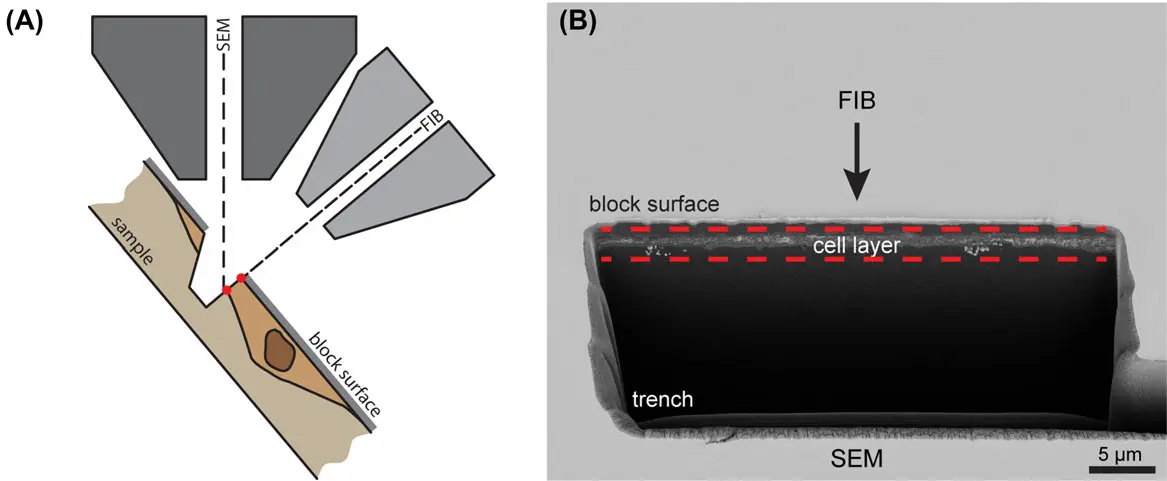
Organelles do not function in isolation; rather, they exchange lipids, ions, and signaling molecules at highly specialized microdomains known as membrane contact sites (MCSs), where heterologous membranes are closely tethered without undergoing fusion [3], [3]. Because MCSs are defined by extremely narrow spatial gaps (often <20 nm) extending over small 3D surface areas, SBF-SEM and Focused Ion Beam SEM (FIB-SEM) are essential for their accurate morphological quantification [3].
The interface between the ER and mitochondria is one of the most vital MCSs, regulating calcium homeostasis and coordinating mitochondrial fission [229]. High-resolution block-face imaging and 3D tomography in mammalian cells (such as hepatocytes and HeLa cells) have mapped the exact distribution of ER-mitochondria contacts, demonstrating that 10% to 20% of the mitochondrial outer membrane surface can be occupied by closely apposed ER membranes [229], [229]. Specifically, 3D segmentation identified unique, osmiophilic bridge-like structures spanning approximately 50 nm that physically tether the two organelles. Intriguingly, these ER contacts were frequently observed accumulating directly at mitochondrial constriction zones, highlighting the structural role of the ER in modulating mitochondrial dynamics [229], [229], [229], [229], [229].
SBF-SEM is equally powerful for investigating metabolic contacts across aging tissues. In murine brown adipose tissue (BAT), volumetric reconstructions were utilized to map the intricate interactions between mitochondria and energy-storing lipid droplets (LDs) [231], [231], [233]. Quantitative assessment revealed that individual mitochondria can simultaneously tether to multiple (up to four) distinct lipid droplets [231], [233]. Crucially, morphometric analysis of these MCSs over the organism's lifespan demonstrated that while the total volume of individual lipid droplets diminishes with age, the average volume and total surface area of individual mitochondria-LD contact sites significantly decrease, suggesting a structural tightening and functional remodeling of these metabolic junctions during aging [231], [233], [233], [231], [233], [233], [231], [233].
Membrane contact site analysis via SBF-SEM also illuminates mechanisms of host-pathogen interaction. In human intestinal cells infected by the microsporidian parasite *Encephalitozoon intestinalis*, large-scale 3D reconstructions of the infected cells quantified the physical appositions between the parasite's parasitophorous vacuole (PV) and host cell organelles [102], [102]. Segmentation indicated that the majority of potential contact sites occurred between the PV and host mitochondria (42%), followed closely by the host ER (33%) and the nucleus (25%). Notably, SBF-SEM captured instances where the PV induced small physical indentations in the host nuclear membrane, visually mapping how the pathogen structurally orchestrates the recruitment of host metabolic organelles to its replicative niche [102], [102].
Correlative Light and Electron Microscopy (CLEM) for Targeted Organelle Analysis
A significant inherent limitation of broad-field SBF-SEM is the sheer immensity of the resulting data, which makes the discovery of rare, transient, or dynamic subcellular events incredibly time-consuming—often likened to finding a needle in a haystack [3], [3], [3]. Correlative Light and Electron Microscopy (CLEM) elegantly circumvents this bottleneck. By integrating functional, time-resolved fluorescence microscopy (FM) with volume electron microscopy, researchers can selectively target and structurally resolve specific organelle subpopulations identified during live-cell imaging [50], [26], [5].
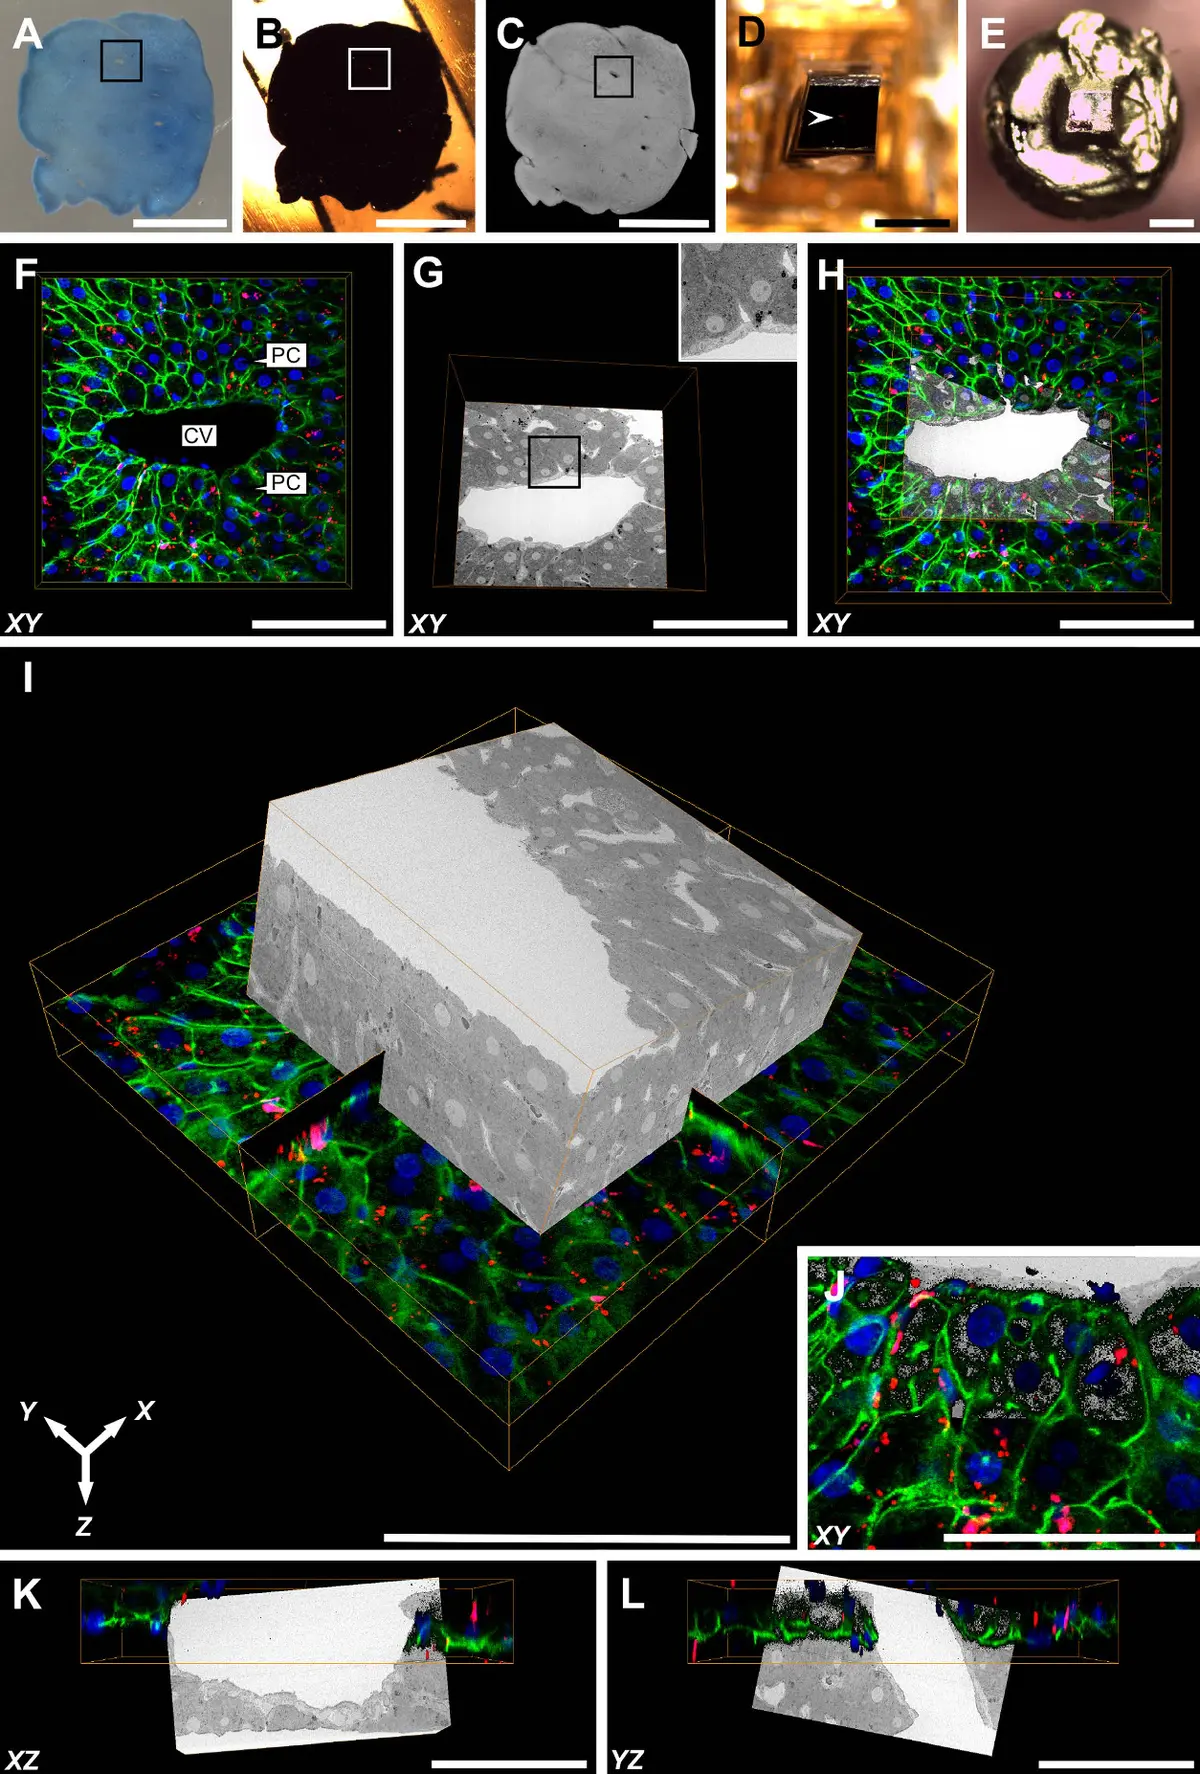
Recent methodological advancements have tightly integrated 3D confocal laser scanning microscopy (CLSM) directly with targeted block-face milling pipelines [3], [3]. To overcome the challenge of aligning dynamic fluorescent signals with fixed electron density maps, researchers employ endocytosed multimodal fiducial nanoparticles that remain robustly fluorescent even within dense epoxy resins [3], [3], [3]. These fiducials provide highly precise 3D anchor coordinates, yielding a spatial correlation accuracy of less than 100 nm in the x-y plane. This pinpoint accuracy enables researchers to image specific cellular domains with minimal required milling, drastically reducing acquisition times [3], [3], [3], [3].
This fluorescence-guided volumetric targeting has been masterfully applied to study the spatiotemporal regulation of MCSs. For instance, live-cell imaging utilizing fluorescent markers for both lysosomes and the ER was used to track transient, nanometer-scale ER-lysosome contact sites over several minutes [3], [3], [3], [3]. Following live observation, the cells were rapidly fixed in situ, and the precise organelle interaction sites were targeted for 3D block-face electron microscopy [3], [3], [3]. The resulting high-resolution SBF-SEM segmentations demonstrated that dense, sheet-like ER cisternae physically wrap around specific domains of the lysosomal surface [3], [3]. This structural wrapping correlates directly with the live-cell tracking data, proving that dense ER interactions act as physical blockades that restrict and steer lysosome motility, while simultaneously flattening the membrane curvature of the lysosome at the site of contact [3], [3], [3].
Moreover, targeted volume-CLEM uniquely allows for the structural dissection of homotypic organelle interactions over time. By tracking multiple distinct lysosomes interacting and moving together in living cells, and subsequently capturing those exact same organelles via SBF-SEM, investigators can examine the internal ultrastructure driving specific organellar behaviors [3], [3], [3]. For example, 3D reconstructions can discriminate whether an interacting organelle tracked by fluorescence is a dense, mature lysosome, or a late endosome filled with intralumenal vesicles [3], [3], [3]. By linking real-time molecular dynamics and motility data directly to nanometer-scale 3D anatomy, CLEM-guided SBF-SEM provides a comprehensive paradigm for modern organelle cell biology [3], [3], [3].
***