kensho BSED
See the true nature of things.
The kensho versus a standard BSED
Mouse skin, imaged under identical high-speed, low-dose conditions on each detector.

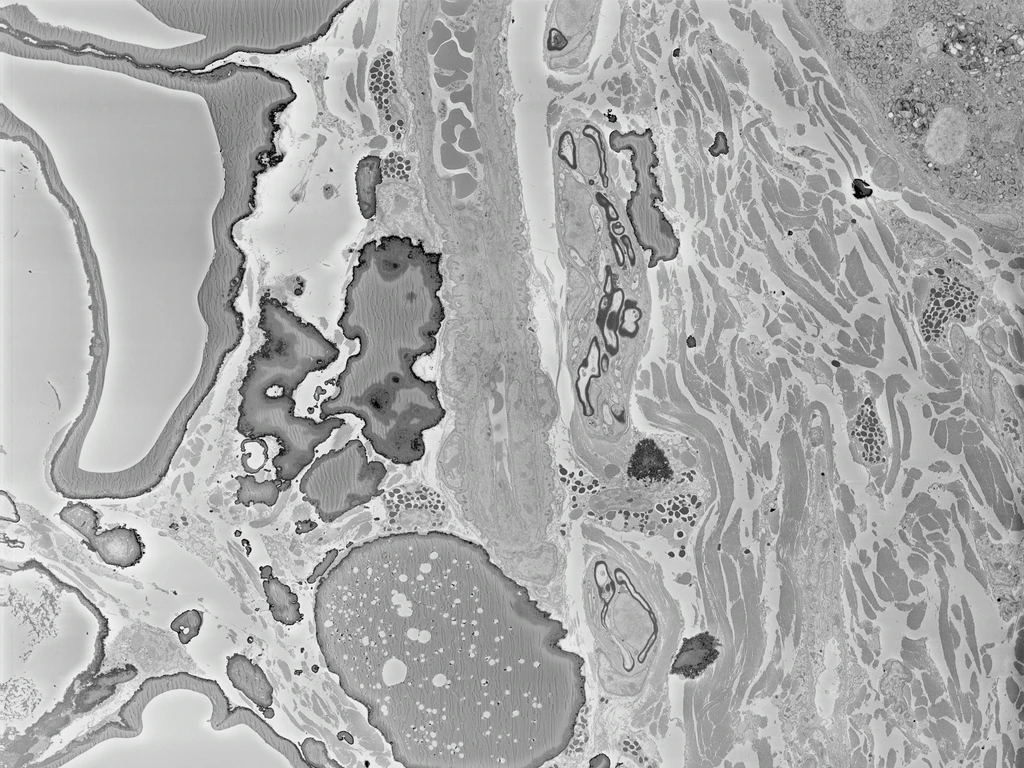
kensho BSED
Standard BSED
Sample courtesy of Prof. Hilda Amalia Pasolli, The Rockefeller University
Equalised. Still different.
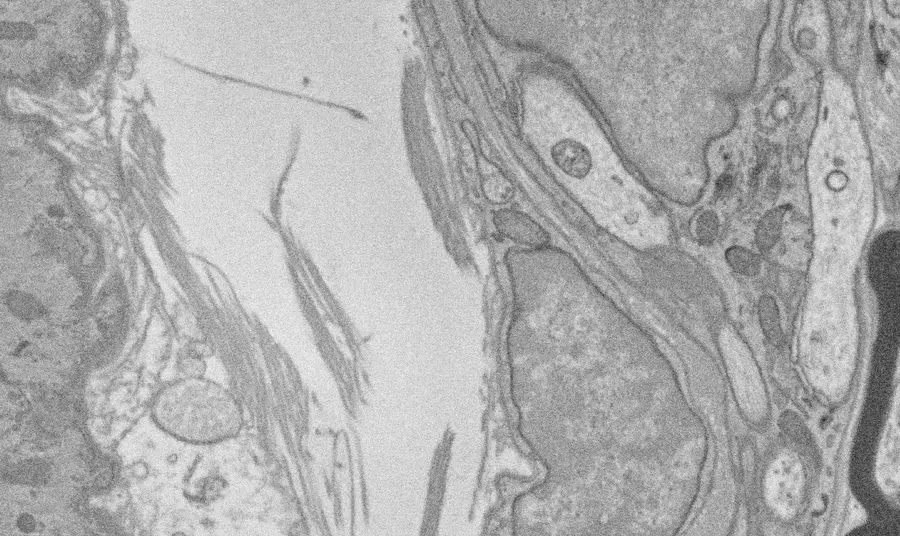
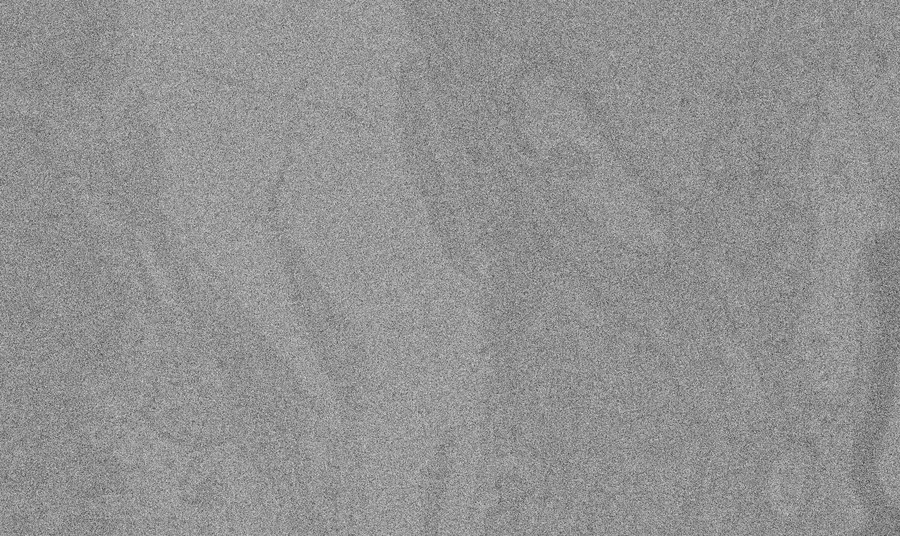
Histogram equalisation on both frames — this is not a contrast trick. The standard detector is noise. The kensho still has signal.
A picture, not grain
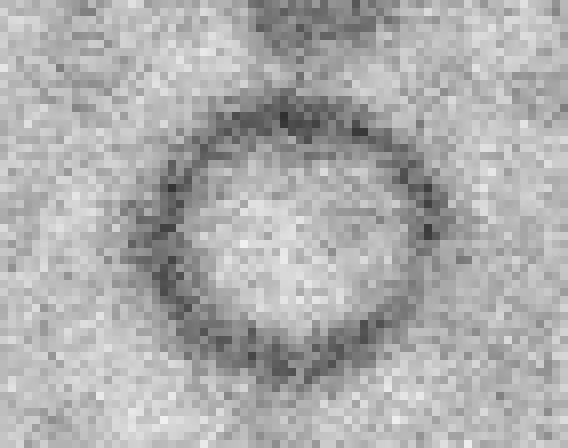
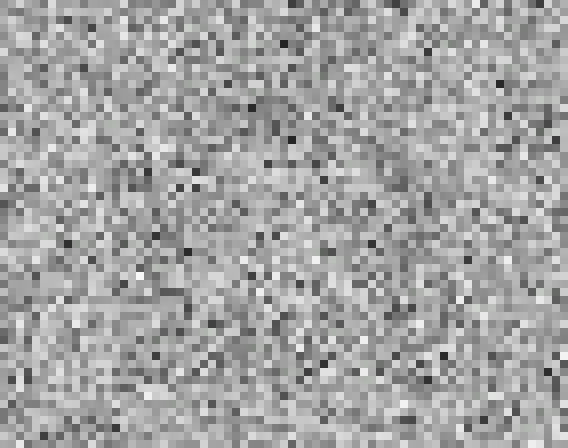
Push in and the standard BSED is static. The kensho still resolves a real feature — same speed, same dose.
Specifications
Every figure the detector is built around.
detector performance
56:1
signal-to-noise ratio
350 ns
rise time
2.5 MHz
detector speed
15 V
maximum bias
geometry
- active area63 mm²
- apertureø1 mm
- detector thickness0.5 mm
mechanical
- insertion repeatability3.2 μm
- insertion and retractionMotorised
See it for yourself.
Everything on this page comes down to one idea: collect more of the signal the sample already emits. The rest — the speed, the contrast at low kV — follows.