Connectomics: Mapping Neural Wiring Diagrams
A distinctive architectural feature of the brain is the highly complex, point-to-point network of synaptic connections that wire neurons together into functional circuits [73, 218]. Deciphering this physical wiring diagram—an endeavour known as connectomics—is widely considered a critical step toward understanding how the brain processes information, supports perception, drives learning and memory, and regulates emotion [72, 73, 123]. Furthermore, mapping the connectome holds immense potential for revealing the structural substrates of neurological and psychiatric conditions, such as Alzheimer’s disease, Parkinson’s disease, autism, and schizophrenia, which frequently exhibit profound synaptic impairments [73, 123].
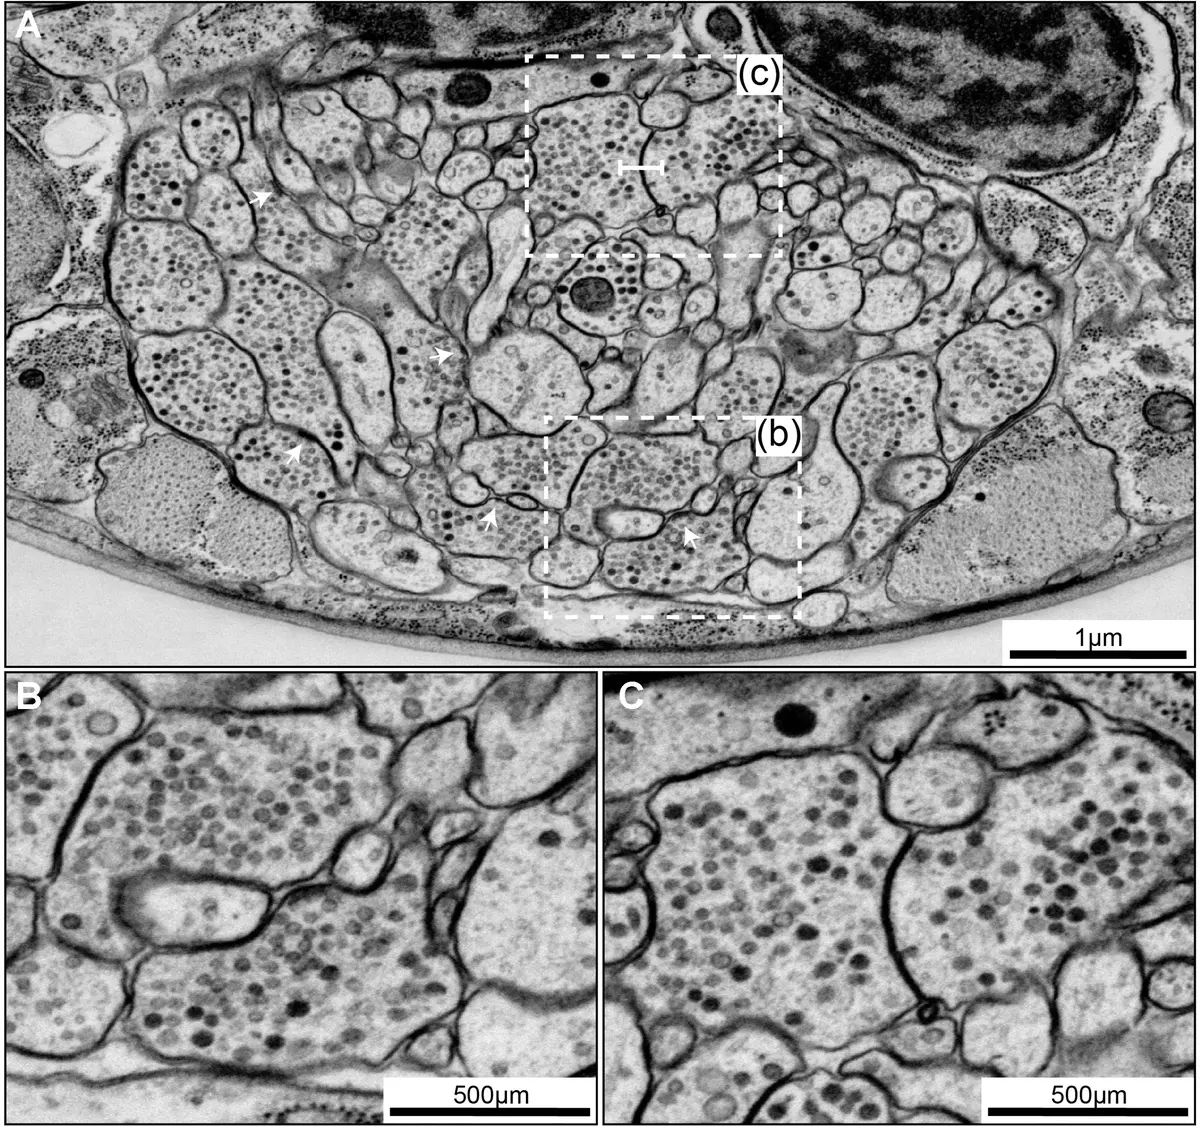
Because the finest neuronal processes—such as unmyelinated axons and the necks of dendritic spines—frequently measure less than 100 nm and 50 nm in diameter respectively, resolving these structures requires three-dimensional (3D) imaging at the nanometre scale [71, 72, 86]. Consequently, volume electron microscopy (vEM) remains the only imaging modality capable of providing the requisite resolution to unambiguously identify every axon, dendrite, and synaptic contact within densely packed neuropil [71, 72, 86, 123].
The Evolution of Volume EM for Connectomics
Historically, the gold standard for producing comprehensive wiring diagrams was serial section transmission electron microscopy (ssTEM) [36]. The pioneering effort in connectomics—the complete mapping of the nervous system of the nematode *Caenorhabditis elegans*—was achieved through the heroic, fully manual reconstruction of ssTEM micrographs over the course of more than a decade [13, 88, 91, 166, 180, 222]. While ssTEM provides unparalleled lateral resolution (often <0.5 nm per pixel) and great flexibility regarding imaging parameters [16, 50], it is heavily reliant on the manual collection of thousands of ultrathin sections [72, 73, 123]. This manual handling is not only enormously time-consuming but also introduces physical distortions, section compression, and a significant risk of losing or folding sections [13, 72, 88]. The computational alignment and registration of such distorted image stacks subsequently pose massive hurdles for automated data analysis [13, 72] (Figure 36).
The advent of automated volume EM techniques, particularly Serial Block-Face Scanning Electron Microscopy (SBF-SEM) and Focused Ion Beam Scanning Electron Microscopy (FIB-SEM), has revolutionized the feasibility of large-scale connectomics [31, 50, 72, 73, 86, 91, 123]. By incorporating a microtome directly inside the vacuum chamber of a scanning electron microscope, SBF-SEM continuously alternates between cutting ultrathin sections (typically 30–50 nm) from the face of a resin-embedded tissue block and acquiring back-scattered electron images of the freshly exposed surface [13, 50, 72, 88, 123, 222]. Because the images are acquired from the rigid block face prior to section removal, SBF-SEM inherently bypasses the manual handling of fragile sections, generating image stacks that are pre-aligned and virtually free of the mechanical distortions that plague ssTEM [13, 31, 72, 88, 123, 222] (Figures 37–38).
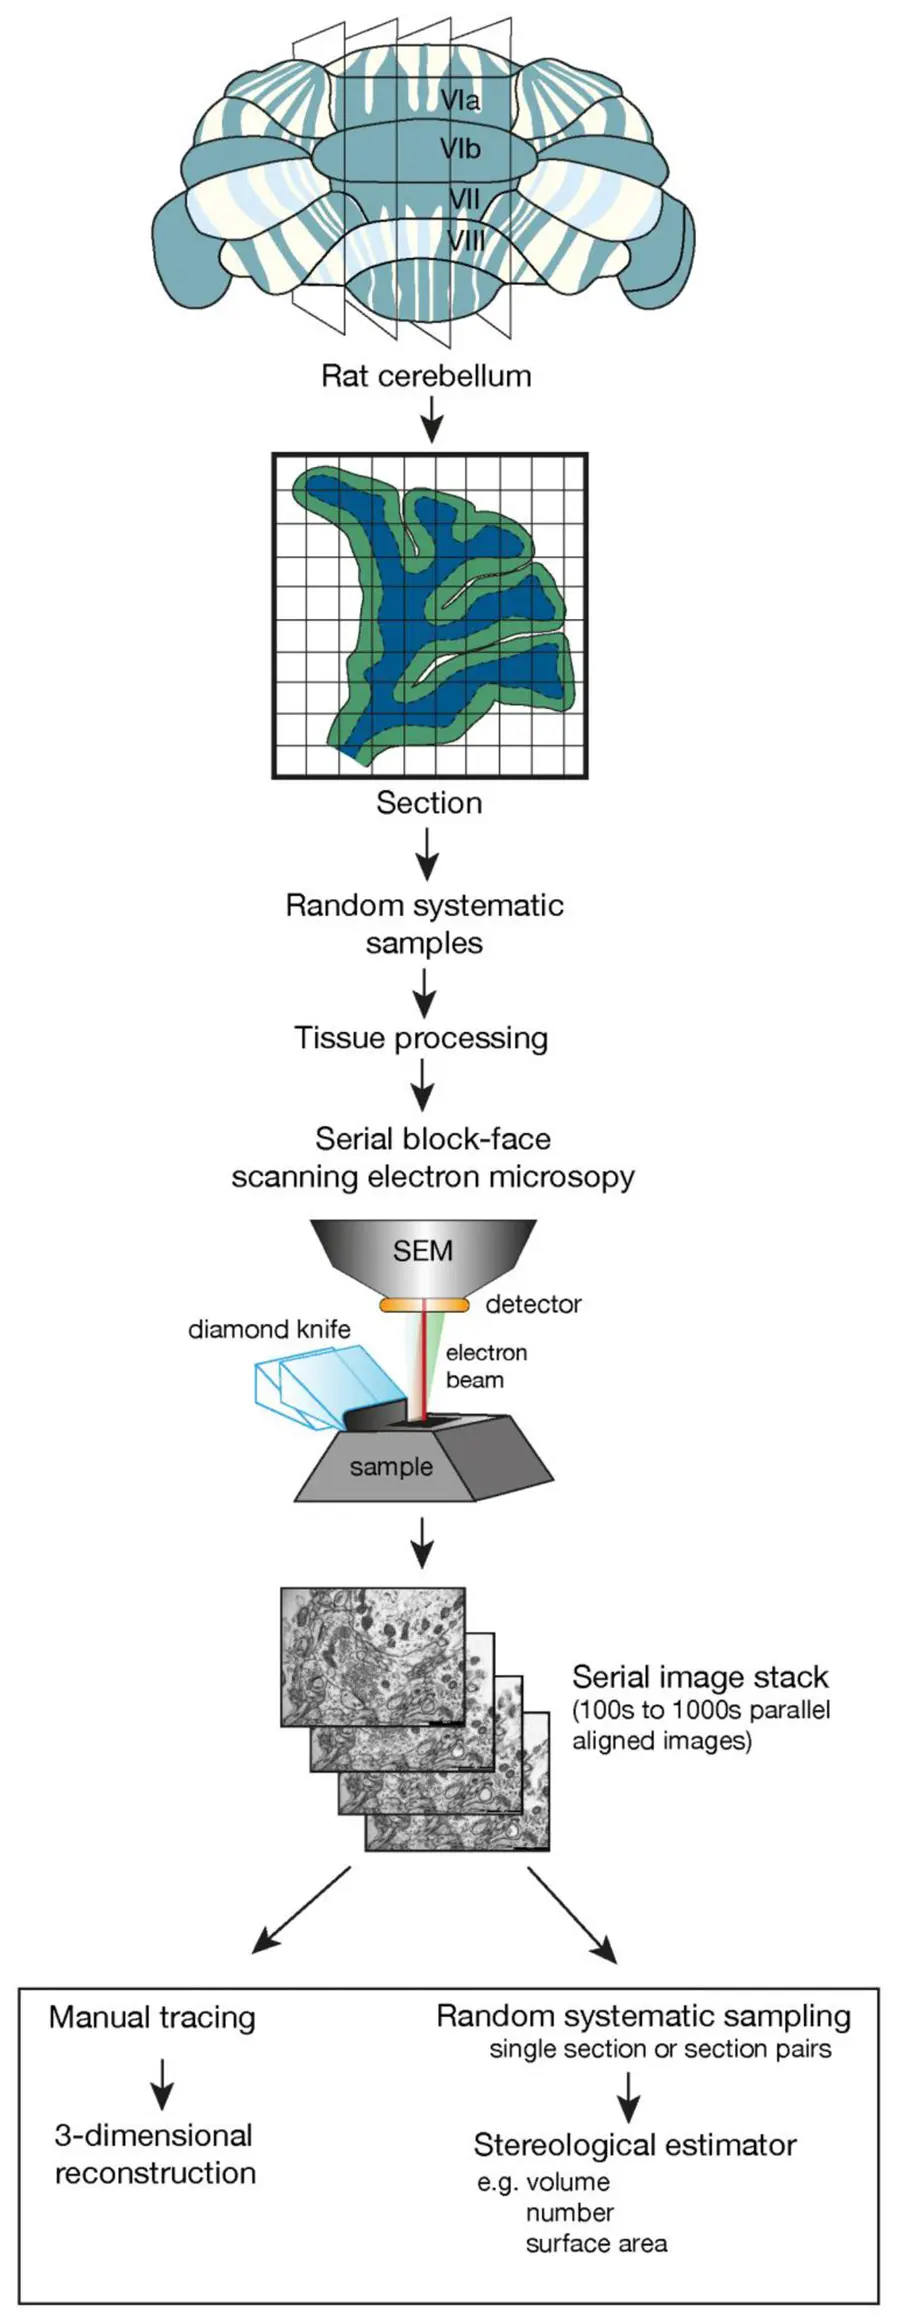
While SBF-SEM cannot quite match the 5 nm isotropic resolution of FIB-SEM [50], it is optimally suited for the "mid-range" of connectomics [16]. FIB-SEM is largely restricted to small, high-resolution tissue volumes due to slow milling speeds [16, 180], whereas SBF-SEM routinely captures volumes ranging from to , easily encompassing the spatial extent required to map extensive local microcircuits [16, 50]. Alternatively, Automated Tape-collecting Ultramicrotome SEM (ATUM-SEM) offers a hybrid approach by automatically collecting sections on a continuous tape, allowing for post-staining and repeated imaging of regions of interest [16, 86, 88, 159, 166].
Dense Circuit Mapping and Global Initiatives
The automation of vEM has inspired a renaissance in 3D neuroanatomy and catalysed major international scientific initiatives [73, 123]. Flagship programmes such as the BRAIN Initiative in the United States, the Human Brain Project in Europe, and the Brain/MINDS project in Japan (which focuses on the common marmoset model) have all heavily invested in technologies to accurately map brain circuitry at unprecedented scales [73].
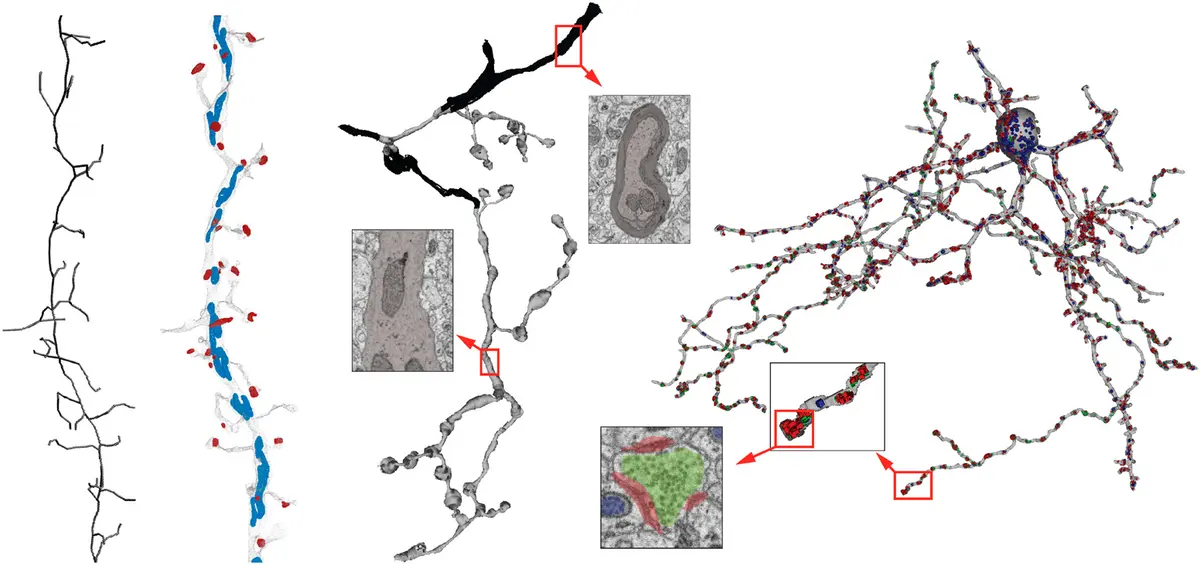
Connectomics analyses typically fall into one of two categories: sparse or dense reconstruction [88, 164, 210]. Sparse reconstruction focuses on tracing only a defined, selected subset of neurons—such as a specific sensory afferent pathway—to extract targeted structural features or myelination profiles [88, 164, 210]. Dense (or saturated) reconstruction, by contrast, is the defining hallmark of true connectomics. It requires the segmentation of every single neuronal profile within a defined volume to generate a complete connectivity matrix [88, 164, 220].
Saturated reconstructions leveraging SBF-SEM and related vEM techniques have scaled dramatically over the past decade [72, 220]. Beyond the foundational *C. elegans* connectome—which is still being refined using modern vEM pipelines incorporating CATMAID and VAST software [166]—researchers have produced dense wiring diagrams for a vast array of species [16]. Significant milestones include the mapping of complete microcircuits in the *Drosophila* optic lobe and central brain [88, 180], the mapping of interglomerular projection networks in the zebrafish olfactory bulb [82], the reconstruction of the larval zebrafish spinal cord [220], and the elucidation of complex synaptic pathways in the locust visual collision-detection circuit [88]. More recently, researchers have combined SBF-SEM with voltage-sensitive dye imaging to map the complete connectome of behavioural circuits in the annelid worm [192]. In the mammalian brain, vEM has been deployed to generate saturated reconstructions of the inner plexiform layer of the mouse retina [16, 88, 180, 188], the mouse visual thalamus [210], and large segments of the mouse somatosensory and visual cortices [16, 169, 173, 191, 197, 218].
However, performing dense connectomic reconstructions on a single, massive block of tissue from one individual inherently limits the ability to account for biological variability [218, 221, 222]. In mammalian and human brain research, where interindividual variability is highly pronounced and structures are vast, some researchers advocate for an alternative stereological approach [221, 222]. Rather than attempting a single saturated reconstruction of an entire brain region, researchers can use focused SBF-SEM or FIB-SEM to sample multiple smaller volumes (e.g., ) from targeted regions—such as the human entorhinal cortex, or the mouse hippocampal stratum radiatum and somatosensory cortex [123, 218, 221]. Software such as Espina can then be utilized to rapidly trace simplified "skeletons" of dendrites and axons, quantify synaptic densities, and calculate the synaptic apposition area without the exhaustive burden of fully rendering the neuropil [151, 179, 218].
The Data Avalanche: Bottlenecks in Reconstruction
While modern vEM instrumentation can acquire teravoxel datasets encompassing entire microcircuits within a matter of weeks, the subsequent data analysis requires years of concerted manual labour [86, 220]. The scale of the data is staggering: a single cubic millimetre of mammalian cortex contains millions of neurons, thousands of metres of intertwining neurites, and roughly a billion synapses [86]. Imaging just of human tissue generates approximately 1.4 petabytes of raw data [221].
The primary bottleneck in connectomics is no longer image acquisition, but rather image segmentation—the process of delineating cellular boundaries and identifying synaptic contacts across thousands of serial sections [14, 88]. Fully manual segmentation is agonizingly slow. For instance, the dense reconstruction of merely 950 neurons in the mouse retina required nearly 30,000 hours of human labour [14, 86]. It has been estimated that for a single human to manually reconstruct all the wiring in of mammalian cortex, it would take over 2,200 years [14].
To manage this burden, neuroscientists initially turned to collaborative platforms and "crowdsourcing." Tools like CATMAID, webKnossos, VAST, and TrakEM2 allow multiple annotators to simultaneously trace skeletons or paint voxels across a distributed network [16, 35, 86, 166, 180]. The SBF-SEM pioneers in the Denk laboratory recruited hundreds of undergraduate students to trace skeletons redundantly in KNOSSOS, using consensus algorithms to overcome human error [82, 86]. Meanwhile, gamified platforms like EyeWire and FlyWire have successfully harnessed the collective effort of thousands of citizen scientists to proofread automatically generated segmentations of retinal and *Drosophila* neurons [9, 16, 86].
Deep Learning and Automated Circuit Extraction
Given the impossibility of manual scaling, the field has aggressively pursued automated segmentation using advanced machine learning, particularly deep convolutional neural networks (CNNs) [14, 16, 86, 171, 180, 220]. The current state-of-the-art for neuron reconstruction relies on CNN architectures—most notably the 3D U-Net and its derivatives—to predict the probability that a given voxel belongs to a cell boundary or a cell interior [16, 128, 171].
Because purely automatic segmentation remains prone to topological errors (such as falsely merging two distinct neurites or improperly splitting a continuous axon), algorithms generally employ a "bottom-up" approach [171, 180]. The CNN boundary probability maps are processed using algorithms like the watershed transform to divide the tissue into thousands of conservative, over-segmented fragments called "supervoxels" [171, 173, 179, 180, 220]. These supervoxels are subsequently linked together (agglomerated) into full 3D neuron models either through learned affinity graphs, region-agglomeration heuristics, or human proofreading along a skeletonized center-line [115, 171, 180]. More recently, architectures such as Flood-Filling Networks (FFNs) have demonstrated remarkable success by combining boundary detection and agglomeration into a single, cohesive neural network capable of tracing complex neurites with greatly reduced proofreading requirements [16, 171, 173, 180].
Automated Synaptic Connectivity Inference
Deriving a true wiring diagram requires more than just tracing neurite morphology; one must definitively identify the locations where these neurites communicate [220]. In manual workflows, searching for and annotating hundreds of thousands of synaptic junctions is just as time-consuming as saturated neurite reconstruction [220]. Consequently, automated synapse detection has become a primary target for machine learning innovation [16, 220].
Synapse identification in vEM data presents a unique computer vision challenge due to the sparsity of synapses relative to the total tissue volume, the non-isotropic nature of some SBF-SEM datasets, and the visual subtlety of synaptic specialisations [220]. Early efforts required extensive manual seeding or highly specific staining protocols [14, 88, 180], but modern pipelines utilize multi-class CNNs to identify ultrastructural hallmarks directly from conventionally stained tissue [220]. Because relying solely on the presence of plasma membrane apposition is insufficient for identifying functional synapses [220], these algorithms are trained to detect the co-occurrence of presynaptic vesicle clouds, mitochondria, and electron-dense synaptic clefts [173, 220] (Figure 39).
A major leap forward in this domain is the SyConn framework, and its highly scalable successor, SyConn2 [173, 220]. Rather than simply returning raw voxel probabilities, SyConn accepts dense neurite reconstructions and raw EM imagery as inputs, and generates a richly annotated, queryable connectome [173, 220]. To achieve this, SyConn processes datasets using a combination of CNNs and Random Forest Classifiers (RFCs) [220]. First, CNNs detect and segment sub-cellular structures—specifically synaptic junctions, vesicle clouds, and mitochondria [173, 220]. These objects are then mapped onto the neurite segmentations [173, 220].
Next, Random Forest Classifiers analyze the local spatial distribution of these organelles, combined with morphological features extracted from the neurite's shape (such as a histogram of local radius measurements), to classify subcellular compartments [173, 220]. With high accuracy, the algorithm determines whether a given skeletal node represents a somatic region, a dendritic shaft, a dendritic spine head, a spine neck, or an axon [220]. The integration of CNN-derived organelle data directly informs this geometric classification; for instance, the density and size of mitochondria and vesicle clouds differ substantially between axons and dendrites [173, 220].
Furthermore, by evaluating the aggregation of these features across the entire morphology of a reconstructed cell, RFCs can be trained to automatically predict the specific physiological cell type—such as distinguishing between Medium Spiny Neurons (MSNs), Globus Pallidus neurons (GPs), and interneurons (INTs) in the songbird basal ganglia [220]. Remarkably, analysis utilizing the SyConn pipeline demonstrated that specific cell types which exhibit high firing rates *in vivo* possess proportionally higher densities of mitochondria and synaptic vesicles, allowing researchers to potentially infer the physiological properties of unknown neurons based purely on their ultrastructural signatures extracted from SBF-SEM data [220].
The computational demands of processing petabyte-scale connectomes with multi-stage machine learning pipelines are enormous [173]. To handle datasets containing tens of millions of synapses, frameworks like SyConn2 have been aggressively optimized to run on distributed commercial cloud computing platforms [173]. By transitioning from dense voxel representations to lightweight point-cloud representations (e.g., using ConvPoint architectures) for evaluating cell morphology, SyConn2 achieved processing speeds of up to 34 megavoxels per hour per CPU core (and 4.4 gigavoxels per GPU), driving down the computational cost of generating a fully annotated connectome to approximately $2000 per teravoxel [173]. To further democratize access to these massive, automatically generated wiring diagrams, researchers have developed web-based clients like Neuroglancer, allowing biologists to query and visualize multi-terabyte datasets directly in a web browser without needing local supercomputing infrastructure [173].
Bridging Structure and Function
While the extraction of dense wiring diagrams using SBF-SEM provides an unparalleled foundation for neurobiology, structural connectomics inherently lacks molecular and dynamic physiological context [72, 184, 213]. A synapse identified solely by morphological criteria in an electron micrograph does not natively reveal its neurotransmitter phenotype, its receptor composition, or the gene expression profile of its parent cell [184].
Consequently, the future of connectomics lies in multiscale integration. Researchers are increasingly turning to Correlative Light and Electron Microscopy (CLEM) to merge the molecular specificity of fluorescence microscopy with the nanometre resolution of vEM [2, 184, 185]. By employing near-infrared branding or inherent tissue fiducials (like blood vessels and nuclei), scientists can image the *in vivo* calcium dynamics or voltage activity of specific neuronal populations using two-photon microscopy, subsequently fix the tissue, and seamlessly locate those exact same cells within an SBF-SEM volume for dense synaptic reconstruction [50, 77, 188, 192]. As these pipelines mature, the integration of single-cell RNA sequencing, functional imaging, and SBF-SEM connectomics will provide a truly comprehensive blueprint of the brain, linking molecular identity and real-time neural computation directly to the brain's ultimate wiring diagram [72, 77, 177, 184, 192].
***