Image Acquisition Parameters and Optimization
Principles of Serial Block-Face Image Acquisition
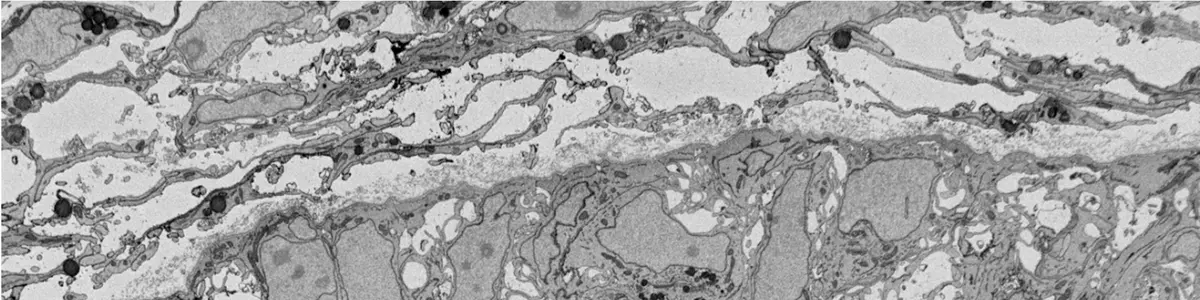
The acquisition of three-dimensional ultrastructural data via Serial Block-Face Scanning Electron Microscopy (SBF-SEM) relies on a continuous, automated cycle of sequential microtomy and scanning electron beam imaging [12, 17]. In this paradigm, an ultramicrotome equipped with a diamond knife is situated directly within the vacuum chamber of the scanning electron microscope (SEM) [12, 17, 32, 33]. Following the removal of an ultrathin slice from the surface of a resin-embedded, heavy metal-stained specimen, the freshly exposed block face is raster-scanned by the electron beam [32, 33, 51, 141]. The resulting backscattered electron (BSE) signal provides atomic contrast analogous to conventional transmission electron microscopy (TEM) [13, 14, 17, 33] (Figure 19).
However, unlike TEM—where imaging parameters can be adjusted on stable ultrathin sections without compromising the bulk sample—SBF-SEM imaging interacts with the entirety of the remaining tissue block [14, 38]. Consequently, establishing optimal image acquisition parameters demands a delicate balancing act. The operator must meticulously optimize accelerating voltage, beam current, pixel dwell time, and section thickness to maximize spatial resolution and signal-to-noise ratio (SNR) while simultaneously minimizing acquisition time, electron charge accumulation, and radiation damage to the resin block [18, 38, 42].
Spatial Resolution and Dimensionality: Pixel Size and Section Thickness
The fundamental architecture of an SBF-SEM dataset is defined by its volumetric resolution, which is inherently anisotropic [18, 137, 143]. The spatial resolution in the transverse () plane is dictated by the electron probe size, the selected pixel dimensions, and the field of view (FOV) [18, 32, 50, 75]. Typical pixel sizes range broadly from 5 nm to 50 nm, depending upon the biological questions being addressed [22, 32, 99]. For the reliable visualization of general cellular organelles, such as mitochondria or the endoplasmic reticulum, an pixel size of 5 to 6 nm is generally deemed sufficient [65, 99]. Conversely, resolving fine ultrastructural details, such as synaptic vesicles, postsynaptic densities, or microtubule networks, necessitates a lateral pixel resolution of less than 5 nm [33, 36, 50]. Because pixel size is inextricably linked to the FOV and the limitations of the detector's pixel array (e.g., 8192 × 8192 pixels), achieving a 3 to 5 nm resolution strictly limits the maximum scannable area to approximately 25 to 40 µm per frame [20, 22, 50, 99].
While resolution is highly tunable, the axial () resolution is constrained by the physical limitations of the in-chamber microtomy process [22, 75, 137]. The thickness of the physical slice removed during each cutting cycle determines the discrete step size in the -axis [25, 32]. Section thicknesses routinely range between 25 nm and 100 nm [22, 47, 50, 66, 116, 139]. Although specialized microtomes can theoretically shave slices as thin as 15 to 20 nm from ideal specimens [22], achieving consistent cuts below 25 nm is physically challenging [20, 22, 29, 38, 50]. The mechanical stress of slicing, combined with the material properties of the embedding epoxy resin, often results in uneven cutting or missed slices at highly reduced thicknesses [13, 22]. Consequently, an SBF-SEM voxel is characteristically elongated in the -direction (e.g., 5 × 5 × 25 nm to 10 × 10 × 50 nm) [29, 38, 50, 65, 76, 137]. By contrast, Focused Ion Beam SEM (FIB-SEM) can achieve truly isotropic voxels (e.g., 5 × 5 × 5 nm) due to the arbitrary precision of ion milling, though it is limited to substantially smaller total tissue volumes than the SBF-SEM approach [20, 28, 32, 38, 143].
Beam Energetics: Accelerating Voltage and Beam Current
Because SBF-SEM relies heavily on the detection of backscattered electrons to differentiate heavy metal-stained biological structures from the low-atomic-number resin matrix, the kinetic energy of the incident electron beam is a critical variable [14, 51, 65]. Accelerating voltages in SBF-SEM are typically maintained in the low-kilovolt range, conventionally between 1.0 kV and 3.0 kV [8, 22, 28, 65, 66, 91, 123, 144].
The selection of accelerating voltage governs the penetration depth of the primary electron beam—and therefore the interaction volume—which directly impacts both contrast and the effective -resolution [18, 19, 28, 32, 50]. At higher accelerating voltages (e.g., >3.0 kV), incident electrons penetrate deeper into the sample [18]. If the interaction volume extends beyond the thickness of the planned microtome slice, subsurface structures will contribute to the BSE signal, creating a "ghosting" effect that blurs the -resolution and complicates downstream segmentation [18, 28, 50]. Furthermore, deeper beam penetration irradiates and damages the underlying tissue that has yet to be imaged and sectioned [18, 19].
Conversely, employing a lower accelerating voltage (e.g., 1.0 to 1.5 kV) restricts electron scattering to the superficial 10 to 30 nm of the block face [32, 42, 51]. This superficial signal confinement ensures that only the immediately exposed surface is imaged, aligning the optical depth of field with the physical slice thickness [28, 32, 42]. However, low accelerating voltages proportionally reduce the total BSE yield, resulting in diminished signal-to-noise ratios (SNR) and lower overall image contrast [18, 56]. To offset this loss of signal, operators must either increase the beam current (spot size) or utilize highly sensitive, low-energy BSE detectors designed specifically for short working distances in volume electron microscopy [18, 19, 77]. Increasing the beam current (e.g., from 50 pA to several hundred pA) provides a denser flux of primary electrons, thereby elevating BSE emission, but this comes at the steep cost of rapidly increasing the total electron dose deposited into the non-conductive resin [18, 28, 66, 140].
Temporal Dynamics, Electron Dose, and Mechanical Damage
The temporal parameters of image acquisition—specifically the pixel dwell time and scan speed—must be carefully calibrated against the vulnerability of the specimen to radiation damage [18, 20, 99]. Dwell time, which denotes the duration the electron beam spends interrogating a single pixel, typically ranges from 0.5 µs to 10 µs [26, 28, 32, 47, 91, 140, 142]. Extending the pixel dwell time increases the collection of backscattered electrons, linearly improving the SNR and producing crisp, high-contrast micrographs [18, 26, 140].
However, maximizing dwell time inherently increases the overall acquisition period—which can stretch from days to weeks for large volumes [18, 29, 77, 91]—and, more critically, elevates the electron fluence (dose) delivered to the specimen [18, 20, 32]. The electron dose is a function of the beam current, pixel size, and dwell time, and represents the number of incident electrons per square nanometer () [18, 91, 138]. Resin-embedded biological tissues are highly susceptible to electron-beam-induced damage, which manifests as broken chemical bonds, free radical formation, and a localized loss of mass [20, 32, 38].
Empirical investigations indicate a strict upper threshold for electron fluence—approximately 20 for standard epoxy resins like Epon, Araldite, or Durcupan—beyond which the physical integrity of the block face is severely compromised [32, 42]. When the sample is irradiated beyond this limit, the resin matrix weakens, softens, or undergoes rapid thermal shrinkage [20, 26, 32]. This radiation damage profoundly interferes with the mechanical efficacy of the in-chamber ultramicrotome [20, 32]. Attempting to section a heavily irradiated, softened block face frequently results in catastrophic cutting artifacts [20, 26]. The diamond knife may "chatter"—bouncing rhythmically across the surface and leaving deep horizontal striations—or it may simply compress the softened resin rather than cleaving it, a phenomenon known as "cut and skip" [13, 20, 26]. In instances of severe "cut and skip," the microtome may fail to remove material for several consecutive cycles before violently gouging a thick layer of tissue, thereby permanently destroying sequential -data [13, 20]. Thus, to maintain uniform, defect-free slicing at thicknesses of 25 to 50 nm, the cumulative electron dose must be strictly minimized, often forcing a compromise that accepts higher image noise in exchange for mechanical stability [26, 32, 38].
Mitigating Specimen Charging: Environmental Controls
Because biological tissues and their embedding resins are fundamentally insulators, the continuous bombardment of primary electrons leads to the accumulation of negative electrostatic charge on the block face [8, 20, 22, 29, 38]. In conventional high-vacuum conditions, these trapped electrons cannot dissipate to ground, resulting in severe charging artifacts [20, 29]. Charging visually manifests as localized image distortion, astigmatism, intense brightness or dark shadowing, and lateral image drift [20, 29, 38, 42, 77, 138]. These artifacts not only obscure critical ultrastructural features but also disrupt the automated alignment algorithms required for successful three-dimensional reconstruction [14, 20, 28, 29, 42].
A traditional method to alleviate charging is to operate the SEM in Variable Pressure (VP) or low-vacuum mode [12, 13, 29, 38, 66, 138]. By introducing a controlled amount of gas—such as water vapor or nitrogen at pressures ranging from 10 to 60 Pa—into the specimen chamber, incident and secondary electrons (SEs) ionize the gas molecules [13, 18, 32, 47, 65, 66]. The resulting positive ions migrate to the specimen surface and neutralize the accumulated negative charge, allowing for stable serial imaging [13, 32, 38]. Nevertheless, this environmental modification carries a heavy penalty: the introduced gas molecules scatter a significant fraction of the primary electron beam before it reaches the sample, leading to beam broadening ("skirting") [13, 20, 32]. This scattering reduces the number of electrons concentrated in the central probe, subsequently degrading both the spatial resolution and the SNR, forcing the operator to use higher dwell times or thicker sections [29, 32, 42].
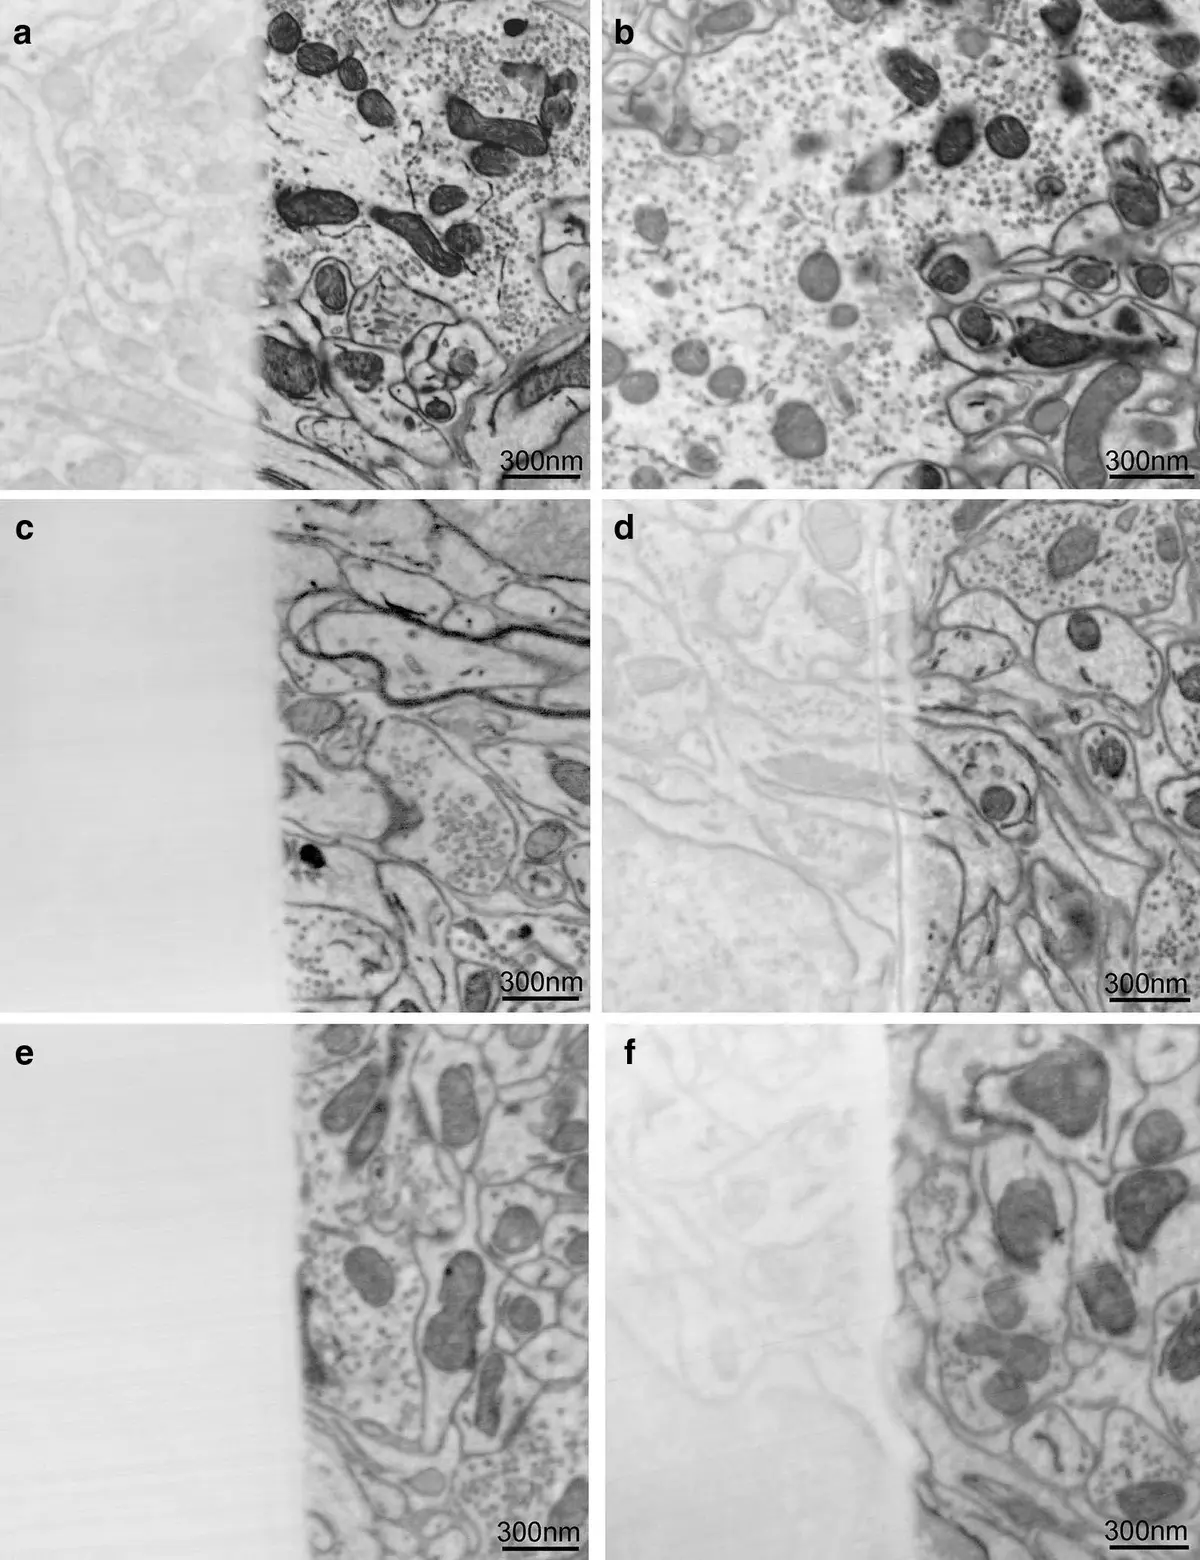
To circumvent the limitations of variable pressure imaging, Focal Charge Compensation (FCC) was developed as a superior alternative [8, 20, 22, 26, 77, 91]. FCC utilizes a microscopic capillary or carbon fiber needle positioned mere millimeters above the block face to locally inject a precise flow of nitrogen gas [26, 32, 77]. The localized gas is ionized by secondary electrons emitted from the sample, neutralizing the surface charge identically to VP-SEM [20, 26, 77]. However, because the gas is restricted to the immediate vicinity of the block face, the bulk of the SEM chamber remains under high vacuum [20, 144]. This preserves the integrity and tight focus of the primary electron beam, enabling high-resolution, high-SNR image acquisition of highly insulating samples (such as cell monolayers or plant tissues) without incurring severe charging or beam dispersion artifacts [20, 22, 26, 42, 91, 144] (Figure 20).
Advanced Mitigation: Stage Biasing and Sample Preparation
Beyond environmental gas controls, charging and resolution trade-offs can be addressed through hardware modifications such as stage biasing (beam deceleration) [20, 51, 138]. By applying a negative electrostatic potential (e.g., -1.0 kV) to the sample stage, the primary electron beam is decelerated just before impact [51]. If the electron column generates a 3.0 keV beam and the stage is biased at -1.0 keV, the actual "landing energy" of the electrons on the block face is reduced to 2.0 keV [51]. This deceleration minimizes the penetration depth of the primary beam, enhancing -resolution and mitigating deep tissue radiation damage [20, 51]. Simultaneously, the negative bias acts to aggressively repel and accelerate the emitted BSEs upward toward the detector, increasing the collection efficiency and the SNR by up to 20-fold [20, 51]. While highly effective, beam deceleration can inadvertently accelerate low-energy secondary electrons toward the detector, creating complex local charging artifacts unless specialized SE-blocking apertures or concentric detectors are employed to isolate the pure BSE signal [51].
Optimization can also be approached through modifications in sample preparation. Embedding tissues in conductive resins—by incorporating carbon black (Ketjen black), silver flakes, or utilizing charge-resistant polymers like PEG 3350—provides a physical grounding pathway that dissipates accumulated electrons through the sample pin [20, 29, 144]. Additionally, "minimal resin" (MR) embedding techniques aim to physically trim away excess empty resin surrounding the biological tissue prior to imaging [29]. Because biological tissues are heavily impregnated with conductive heavy metals (e.g., osmium, uranium, lead) during en bloc staining, they are naturally more conductive than the pure epoxy resin surrounding them [14, 20, 29]. By minimizing the volume of pure insulating resin in the scanning field, MR embedding drastically reduces the occurrence of severe charging streaks, often permitting high-vacuum imaging at lower electron doses without the need for conductive coatings or gas injection [29].
Computational Enhancements to Axial Resolution
While the physical limits of microtomy generally cap the -resolution of SBF-SEM at 20 to 25 nm, recent computational methodologies—specifically Multi-Energy Deconvolution (MED) or sub-slice imaging—have been developed to surpass this mechanical boundary [14, 22, 25, 42]. MED capitalizes on the principle that the penetration depth of the electron beam is strictly proportional to its accelerating voltage [18, 25, 42].
In this technique, the block face is not imaged once, but is instead sequentially scanned multiple times at incrementally increasing primary beam energies (e.g., 1.0 keV followed by 1.4 keV) prior to the next mechanical cut [22, 25, 42]. The lower energy beam (1.0 keV) interacts exclusively with the uppermost strata of the block face (e.g., the top 12.5 nm), while the higher energy beam (1.4 keV) penetrates deeper, generating a composite signal from both the top layer and the subsequent underlying layer (e.g., 12.5 to 25 nm) [25, 42]. By processing these energy-dependent image stacks through a multi-energy deconvolution algorithm or matrix subtraction, the distinct signals from the varying depths can be mathematically decoupled [14, 22, 42]. This computational optical sectioning effectively halves the physical slice thickness, generating "virtual" layers and transforming a 25 nm physical cut into an isotropic or near-isotropic 12.5 nm volumetric resolution [14, 25, 32, 42]. However, acquiring multiple images per physical slice inherently doubles or triples the cumulative electron dose delivered to the block face, necessitating an exceedingly careful optimization of beam current and dwell time to prevent the aforementioned radiation-induced cutting failures [29, 42].
Through the careful modulation and interplay of these acquisition parameters—accelerating voltage, electron dose, physical sectioning limits, and charge mitigation strategies—researchers can reliably extract high-fidelity, large-volume three-dimensional ultrastructural data using SBF-SEM.