Applications in Neuroscience
Introduction to SBF-SEM in Neuroanatomy
Understanding the complex computational algorithms of the brain requires an intricate knowledge of its physical wiring diagrams. Historically, mapping the dense connectivity of neuronal networks—often referred to as connectomics—relied upon serial section transmission electron microscopy (ssTEM) [13, 71, 86]. While ssTEM provides unparalleled spatial resolution, the manual collection, handling, and alignment of thousands of ultrathin sections is incredibly labor-intensive and susceptible to section loss, mechanical distortion, and alignment errors [71, 123]. The advent of Serial Block-Face Scanning Electron Microscopy (SBF-SEM) revolutionized volume electron microscopy (vEM) by placing an automated ultramicrotome directly inside the vacuum chamber of a scanning electron microscope [13, 71, 74, 123].
By iteratively shaving ultrathin sections (typically 25–50 nm thick) from the face of a heavy-metal-stained, resin-embedded tissue block and imaging the freshly exposed surface via backscattered electron (BSE) detection, SBF-SEM produces pre-aligned, high-resolution three-dimensional (3D) image stacks [13, 32, 42, 71, 74, 123]. Although the lateral resolution of SBF-SEM (typically 5–10 nm/pixel) is slightly lower than that of traditional TEM, it is more than sufficient to unambiguously identify fine neuronal processes, trace small-caliber unmyelinated axons (which can be less than 100 nm in diameter), and resolve critical subcellular organelles such as synaptic vesicles and mitochondria [13, 32, 71, 86, 123]. Furthermore, SBF-SEM allows for significantly larger fields of view (e.g., >0.5 × 0.5 mm) compared to focused ion beam scanning electron microscopy (FIB-SEM), enabling the dense reconstruction of expansive neural circuits over hundreds of micrometers [42, 71, 86]. The automated nature of SBF-SEM rapidly generates terabyte-scale datasets, shifting the primary bottleneck of neuroanatomical studies from image acquisition to data segmentation and analysis [11, 86, 191] (Figure 32).
Neural Circuit Reconstruction and Connectomics
The reconstruction of neural circuits is perhaps the most prominent application of SBF-SEM in neuroscience. Prior to automated vEM techniques, the only organism with a fully mapped connectome was the nematode *Caenorhabditis elegans*, an achievement that took over a decade using manual ssTEM [71, 86, 166]. Today, SBF-SEM facilitates the rapid creation of partial and complete connectomes across diverse model organisms [166, 194].
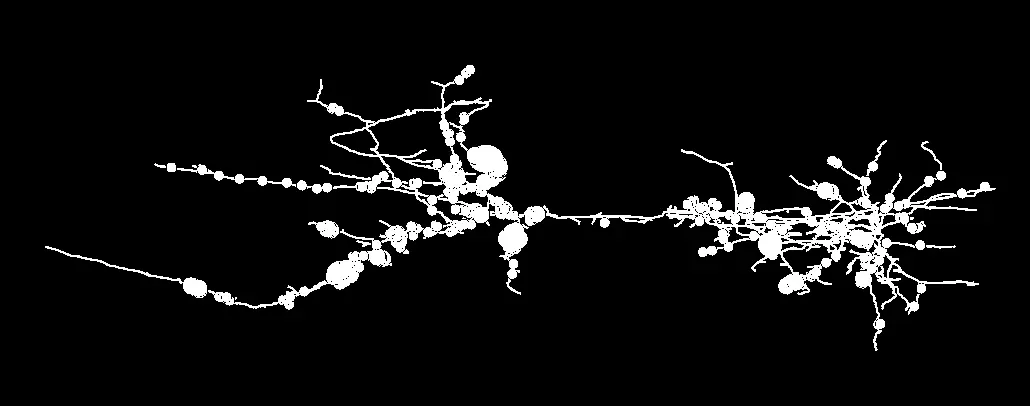
In invertebrate models, SBF-SEM has been used to establish complete wiring diagrams that link anatomy to behavior. For instance, in the leech (*Hirudo verbana*), researchers successfully combined voltage-sensitive dye (VSD) imaging with SBF-SEM to map the behavioral circuits underlying swimming and crawling [192]. By locating the exact same dorsal motor neurons (e.g., DE-3) previously characterized in live physiological recordings, researchers could trace full dendritic arborizations and map hundreds of chemical synapses, revealing both predicted physiological connections and discovering novel presynaptic partners [192, 194]. Similarly, SBF-SEM has elucidated the microcircuitry of the *Drosophila* brain [164, 208], the complete sensory peripheral nervous system in the tail of the cephalochordate *Amphioxus* [200], and the highly specialized collision-detection circuits of the locust (*Locusta migratoria* and *Schistocerca gregaria*), specifically detailing the intricate dendritic inputs onto the Lobula Giant Movement Detector (LGMD) neuron [88, 193].
In vertebrate models, SBF-SEM has achieved major milestones in unraveling the functional microanatomy of the retina and central nervous system. Seminal studies utilized SBF-SEM to reconstruct the inner plexiform layer of the mouse retina, providing dense connectomic maps that led to the discovery of new retinal bipolar cell types and defined the specific wiring underlying direction-selectivity in retinal circuits [32, 86, 95, 188, 194]. SBF-SEM has also been instrumental in mapping motor circuits in the zebrafish (*Danio rerio*) spinal cord, where reconstructions of motor neurons and interneurons in 6 days post-fertilization (dpf) larvae revealed the wiring specificity of speed-related motor behaviors [216]. In the mammalian brain, extensive SBF-SEM datasets have been acquired from the rat and mouse cortex (e.g., somatosensory and visual cortices) to track individual axons, map local synaptic networks, and evaluate the geometric statistics of dense neuropil [71, 191, 206, 210]. The capability to reliably track axons over long distances without the artifacts associated with manual sectioning has been crucial for untangling the complex neuropil of these mammalian regions [71, 206].
Synapse Identification, Counting, and Ultrastructural Characterization
Electron microscopy remains the gold standard for verifying and characterizing synapses, as the synaptic cleft, presynaptic vesicles, and postsynaptic densities (PSDs) are beyond the resolution limit of conventional light microscopy [13, 123]. SBF-SEM allows researchers to reliably trace dendritic segments, identify pre- and post-synaptic profiles, and calculate the absolute distribution and weights of individual synapses across a 3D neuronal network [123, 189].
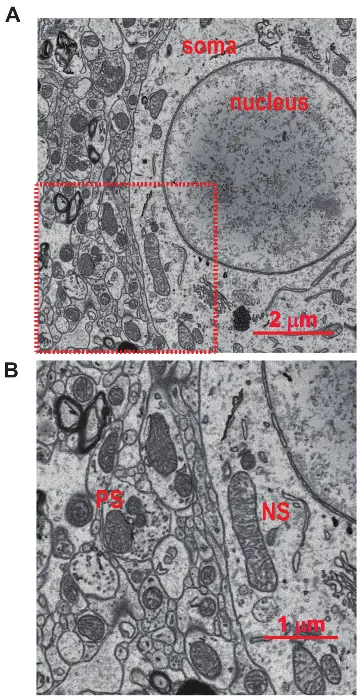
Using stereotypic ultrastructural criteria, synapses can be robustly classified within SBF-SEM volumes. For example, in the mouse primary visual cortex (V1), researchers have mapped the 3D ultrastructure of synaptic inputs onto genetically identified GABAergic interneurons [189]. High-resolution scanning (e.g., 5.1 nm/pixel) allowed annotators to distinguish excitatory (Type I) synapses—characterized by asymmetrical pre- and post-synaptic membranes and large, circular vesicles—from inhibitory (Type II) synapses, which display symmetrical membranes and smaller, oval vesicles [189].
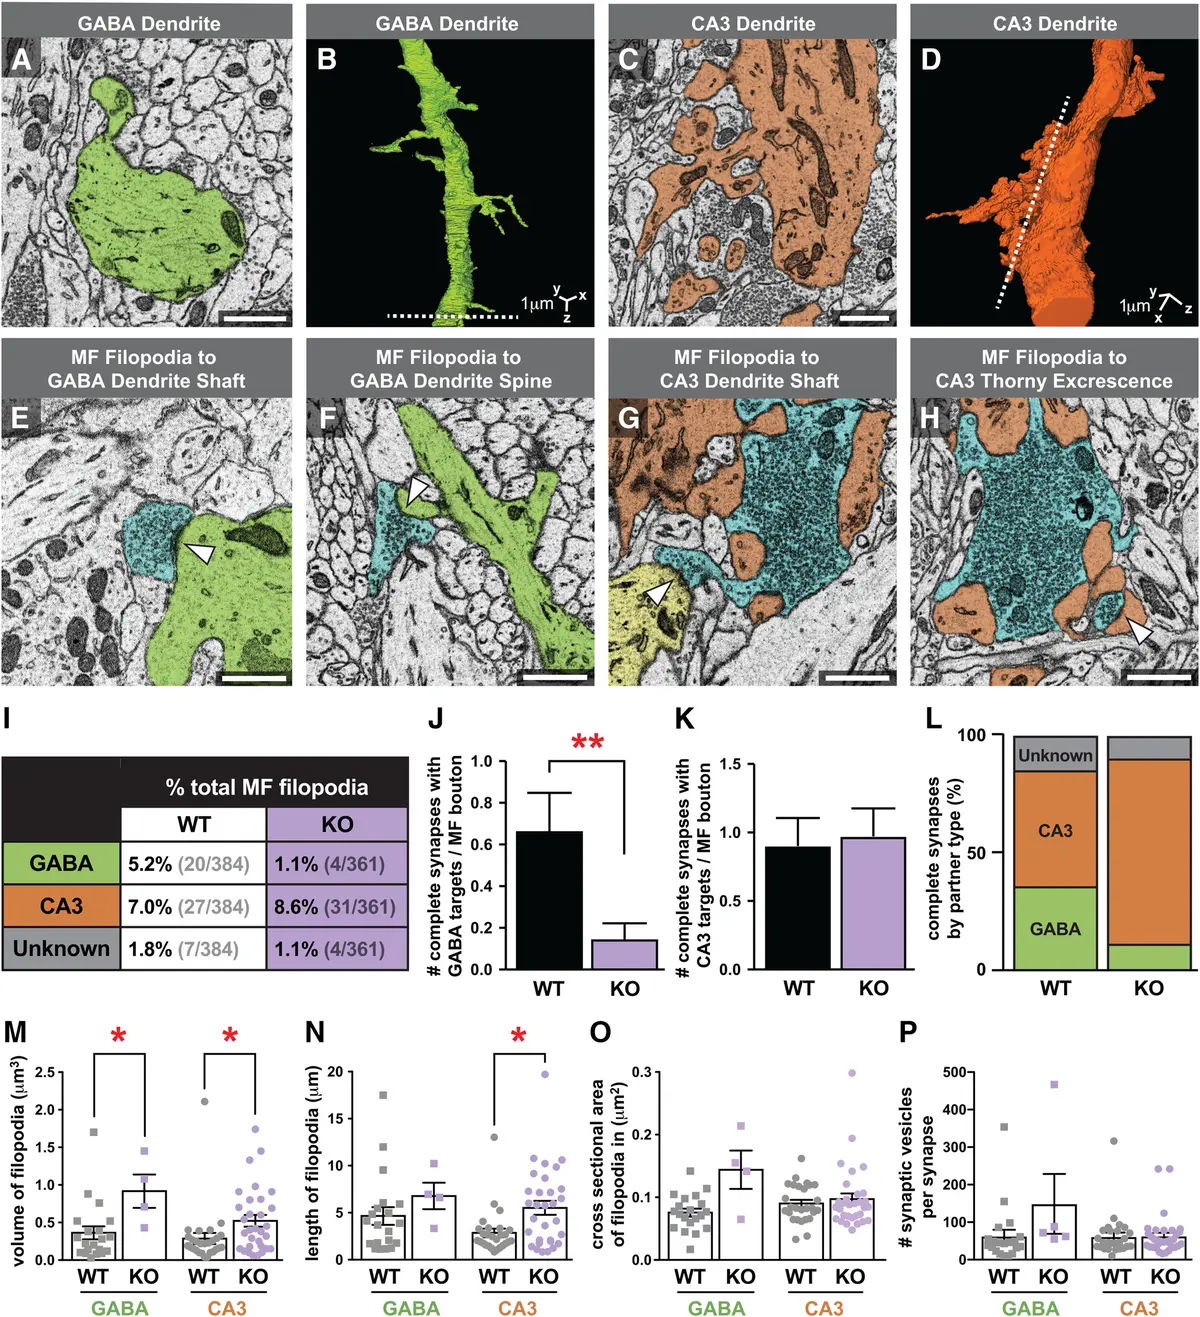
The 3D nature of SBF-SEM is particularly valuable for structurally complex synapses. In the hippocampus, SBF-SEM has been utilized to examine the large, multisynaptic mossy fiber boutons that innervate CA3 neurons, comparing wild-type anatomy with knockout models to understand structural determinants of synaptic transmission [31, 190]. Furthermore, SBF-SEM has been applied to study sleep- and wake-dependent changes in synaptic ultrastructure, allowing the precise volumetric measurement of dendritic spine heads and the area of synaptic contact (ASI) across hundreds of synapses [212]. In the auditory brainstem, the complex meshwork of inhibitory terminals surrounding the soma and proximal dendrites of Lateral Superior Olive (LSO) neurons has been reconstructed via SBF-SEM. This revealed that single inhibitory axons form massive multi-synapse varicosities with multiple active zones, providing the ultrastructural basis for the strong unitary inhibitory postsynaptic currents (IPSCs) observed in these binaural neurons [195].
This high-resolution synaptic mapping has recently been extended to postmortem human tissue. SBF-SEM and FIB-SEM have been utilized to quantify Type 1 and Type 2 synaptic densities, map dendritic spines, and investigate complex filopodia-like invaginating structures in the human prefrontal and temporal cortices [198]. Such studies demonstrate that human autopsy tissue, despite long post-mortem intervals, can preserve adequate ultrastructure for quantitative vEM analysis, opening new avenues for studying synaptic pathology in neurological disorders [198].
Glial Cell Morphology and Glia-Neuron Interactions
For decades, the complete morphological characterization of glial cells was hindered by their incredibly complex, highly branched, and nanometer-thin processes, which are difficult to appreciate in two-dimensional TEM micrographs [177, 210]. SBF-SEM provides the continuous Z-depth necessary to accurately reconstruct the entire highly ramified volumes of astrocytes, microglia, and oligodendrocyte precursor cells (OPCs) [202, 210, 215].
Astrocytes are readily identifiable in SBF-SEM datasets through specific ultrastructural hallmarks, including irregular angular contours, distinct bundles of intermediate filaments, and the presence of electron-dense glycogen granules [146, 155, 215]. Through semi-automated and manual segmentation software (such as Reconstruct, TrakEM2, and Microscopy Image Browser (MIB)), researchers have mapped astrocytic domains and their endfeet contacting blood vessels, revealing that astrocyte processes often interdigitate without forming distinct synaptic structures themselves [35, 146, 210]. Volumetric EM has fundamentally advanced our understanding of the "tripartite synapse," allowing the precise quantification of how perisynaptic astrocytic processes (PAPs) ensheath axo-spinous synapses in regions like the somatosensory and anterior cingulate cortices [202, 217]. Because astrocytic processes can be traced back to their parent soma in large SBF-SEM volumes, researchers can confidently map the territorial boundaries of single astrocytes in the dense cortical neuropil [217].
Microglia, the resident immune cells of the central nervous system, also exhibit distinctive ultrastructural features under SBF-SEM. They are characterized by a relatively dark cytoplasm, electron-dense heterochromatin near the nuclear envelope, long stretches of endoplasmic reticulum (ER), and the presence of lysosomal dense granules and phagosomes [155, 203, 205, 209]. SBF-SEM has proven invaluable for tracking dynamic microglial interactions, such as their engulfment of neuronal cells and contact with apical progenitors during embryonic cortical development [207]. In disease models, SBF-SEM has captured the physical manifestation of neuroinflammation. For example, following *Toxoplasma gondii* infection in mice, 3D reconstructions revealed that reactive microglia intimately contact neuronal somata and physically strip away perisomatic inhibitory synapses [203, 205]. SBF-SEM has also been critical in differentiating resident microglia from infiltrating peripheral monocytes in experimental models of multiple sclerosis, based on subtle ultrastructural differences in mitochondrial distribution, nuclear shape, and osmiophilic granules [199, 205, 209]. The ability to accurately quantify these intracellular and extracellular immune events across large tissue volumes has cemented SBF-SEM as a vital tool in neuroimmunology [199].
Myelination and White Matter Architecture
The structure and integrity of myelin are paramount for the rapid propagation of action potentials, and SBF-SEM has greatly refined our understanding of white matter microanatomy [132]. While traditional 2D analyses assume that axons are perfectly cylindrical, automated 3D axonal morphometry of SBF-SEM datasets from the rat corpus callosum has demonstrated that cross-sections of myelinated axons are actually elliptic, and their diameter varies substantially along their longitudinal axis [115]. Such geometric realities are critical for accurately parameterizing diffusion magnetic resonance imaging (dMRI) data and modeling action potential conduction velocities [115, 197].
SBF-SEM is particularly adept at assessing pathological changes in axonal and myelin morphology following injury. In models of traumatic brain injury (TBI) and optic nerve injury, 3D reconstructions have uncovered profound structural alterations, including significant reductions in myelinated axon diameter, the appearance of focal myelin dystrophies, and changes in the length and distribution of intra-axonal mitochondria [115, 214, 219].
Furthermore, SBF-SEM has cast a new light on myelin biogenesis and the behavior of oligodendrocyte lineage cells during early postnatal development. By reconstructing the early postnatal (P4) mouse optic nerve, researchers captured the intricate 3D ultrastructure of oligodendrocyte precursor cells (OPCs). Unlike astrocytes, these early OPCs possess fewer processes, lack intermediate filaments, and exhibit less complex Golgi apparatuses and immature cilia [215]. As myelination proceeds, SBF-SEM coupled with live-cell imaging has revealed that the generation of myelin is not an entirely error-free process. Volumetric EM identified aberrant myelin structures, such as focal dystrophies and degenerated myelin whorls, which are actively screened, engulfed, and phagocytosed by microglia in a phosphatidylserine-dependent manner, highlighting a novel role for microglia in resolving pathological myelin ultrastructure during normal development [132].
Correlative Light and Electron Microscopy (CLEM)
A persistent challenge in pure vEM is the difficulty of identifying specific, functionally or genetically defined cell types within a vast, monochromatic sea of heavy-metal-stained neuropil [50, 185]. Correlative Light and Electron Microscopy (CLEM) solves this by combining the molecular specificity of fluorescence light microscopy (FLM) with the nanometer resolution of SBF-SEM [77, 185, 189]. However, the aggressive en bloc osmium staining required to generate backscatter contrast in SBF-SEM inherently quenches most fluorescent proteins, necessitating specialized protocols [34, 50, 185, 209].
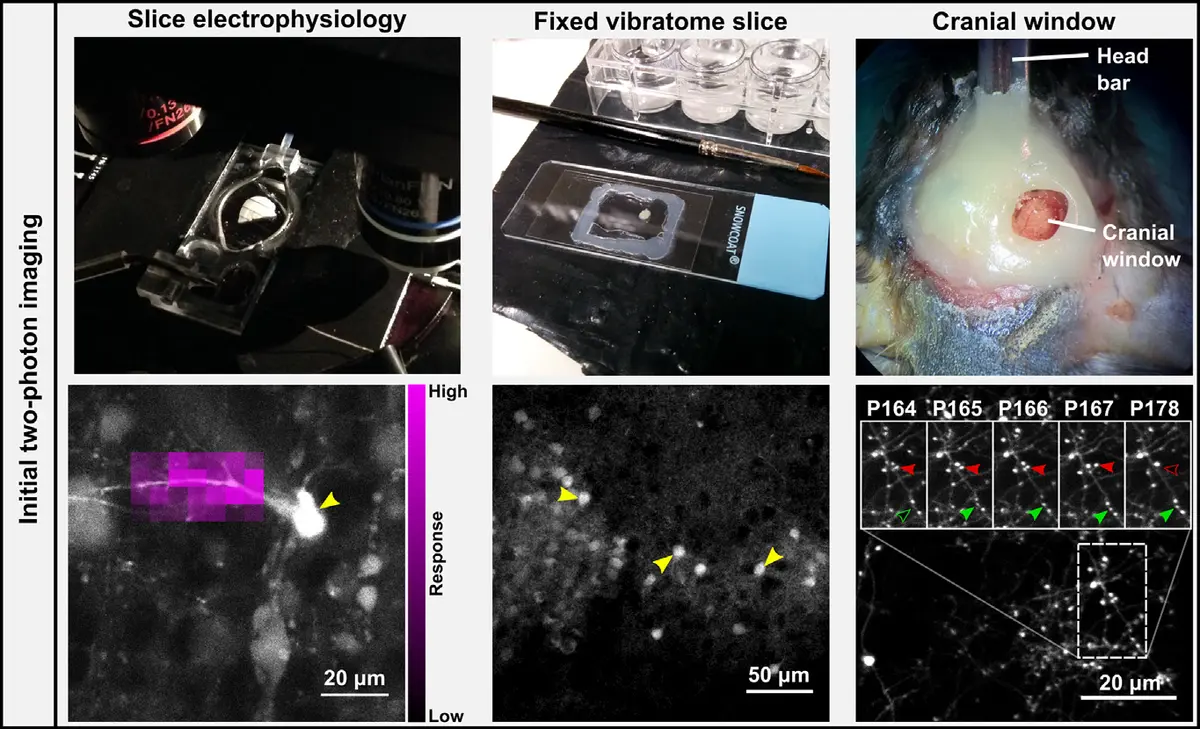
Several strategies have been developed to map light microscopy data onto SBF-SEM volumes. One prevalent approach involves performing *in vivo* two-photon or *ex vivo* confocal microscopy on sparsely labeled neurons (e.g., expressing GFP or tdTomato) prior to heavy metal staining [77, 185, 189]. To relocate these targeted neurons in the electron microscope, researchers often use a near-infrared laser to burn fiducial branding marks (NIRB) into the tissue slice, creating macroscopic boundaries that perfectly bracket the cell of interest [50, 189]. An alternative, less destructive method relies entirely on inherent biological landmarks. By carefully mapping the unique pattern of local blood vessels and the distinct positions of cell nuclei in both the pre-embedding fluorescence images and the semi-thin sections or block-face overview scans, researchers can successfully triangulate the exact location of the target neurites [50, 77, 185] (Figure 33).
These CLEM/SBF-SEM pipelines have been utilized to selectively target and trace specific neuronal populations, such as fluorescently tagged cortico-thalamic axons synapsing in the mouse posteromedial thalamic nucleus [185], or Somatostatin- and Parvalbumin-positive interneurons in the primary visual cortex [189]. Additionally, innovative adaptations like the "mirror technique" have been applied to large tissue blocks, allowing researchers to correlate the layout of immunostained neuronal cell bodies on one face of a sectioning plane with the complementary ultrastructural features in the adjacent SBF-SEM block [213]. Advanced workflows like "SuperCLEM" integrate super-resolution light microscopy with SBF-SEM to generate highly accurate composite 3D models of structures such as nodes of Ranvier in neuron-glia cultures [129]. By bridging the gap between functional imaging and structural mapping, CLEM ensures that the exquisite ultrastructural data provided by SBF-SEM can be interpreted within a defined physiological and molecular context [77, 194, 209] (Figure 34).
Cortical Microanatomy and Future Frontiers
As automation and imaging speeds improve, SBF-SEM is increasingly being deployed to answer broad questions regarding the microanatomy of mammalian neocortical networks [71, 191, 210, 218]. Massive datasets from regions such as the somatosensory (barrel) cortex and hippocampal CA1 have required the development of robust, specialized software platforms for viewing, processing, and segmenting data. Tools like Fiji/TrakEM2, MIB, Reconstruct, Amira, and Blender have become essential for managing these terabyte-scale image stacks [35, 95, 146, 189, 195, 197, 205]. Because manual tracing of axons and dendrites across thousands of sections is a formidable bottleneck for middle-sized laboratories [71, 123], significant efforts are underway to integrate artificial intelligence and machine learning algorithms (such as flood-filling networks and fuzzy tracing algorithms) to achieve fully automated, high-throughput segmentation of these dense neural volumes [31, 123, 191].
Furthermore, SBF-SEM is making substantial inroads into clinical neuropathology. Beyond mapping synaptic densities in human prefrontal cortex [198], the technique has been used to investigate structural abnormalities in epileptogenic focal cortical dysplasia [196] and to map the 3D ultrastructure of human retinal pigment epithelium organelles [95]. SBF-SEM has also solved longstanding anatomical mysteries, such as demonstrating that cerebral corpora amylacea (polyglucosan bodies associated with aging and neurodegeneration) are actually intracellular, existing as dense membranous labyrinths within the endfeet of perivascular astrocytes [201].
In conclusion, SBF-SEM stands as an indispensable technology in modern neuroscience. By providing the ability to reliably image huge blocks of brain tissue at nanometer resolution [13, 32, 42, 123], it permits the dense reconstruction of connectomes, the detailed morphological classification of glia, the quantification of complex synaptic and myelin architecture, and the precise correlation of structure to function [115, 189, 192, 202, 216]. Continued advancements in multi-beam scanning electron microscopes, conductive resins, and AI-driven segmentation promise to scale SBF-SEM applications even further, ultimately paving the way for the routine structural reconstruction of entire mammalian brain regions [73, 123, 180].