Correlative Light and Electron Microscopy (CLEM)
The Rationale for Correlative Light and Electron Microscopy (CLEM) in Volume Imaging
The intricate functionality of biological systems relies on a strict spatial and temporal organisation of molecules, organelles, and cells. Understanding these processes requires imaging modalities that can span multiple scales of resolution and provide both functional and structural information [3]. Fluorescence light microscopy (LM) excels at identifying specific molecular targets, monitoring live-cell dynamics, and tracking rare physiological events across a large field of view; however, it is fundamentally restricted by the diffraction limit of light and lacks the ability to reveal the underlying cellular architecture [127, 183]. Conversely, electron microscopy (EM) provides unparalleled nanometer-scale resolution of the cellular ultrastructure and its native morphological context, but it inherently lacks molecular specificity and cannot be used to observe living, dynamic systems [46, 183].
Correlative light and electron microscopy (CLEM) bridges this divide by integrating the unique strengths of both modalities, allowing researchers to capture dynamic or molecularly defined events via fluorescence microscopy and subsequently track them to their high-resolution ultrastructural context using EM [3, 4, 34, 183]. While early CLEM workflows were largely restricted to two-dimensional (2D) transmission electron microscopy (TEM) of ultrathin sections [46, 183], the modern advent of volume electron microscopy (vEM) technologies—specifically Serial Block-Face Scanning Electron Microscopy (SBF-SEM)—has catalysed the development of three-dimensional or volume CLEM (vCLEM) [3, 46] (Figures 29–31).
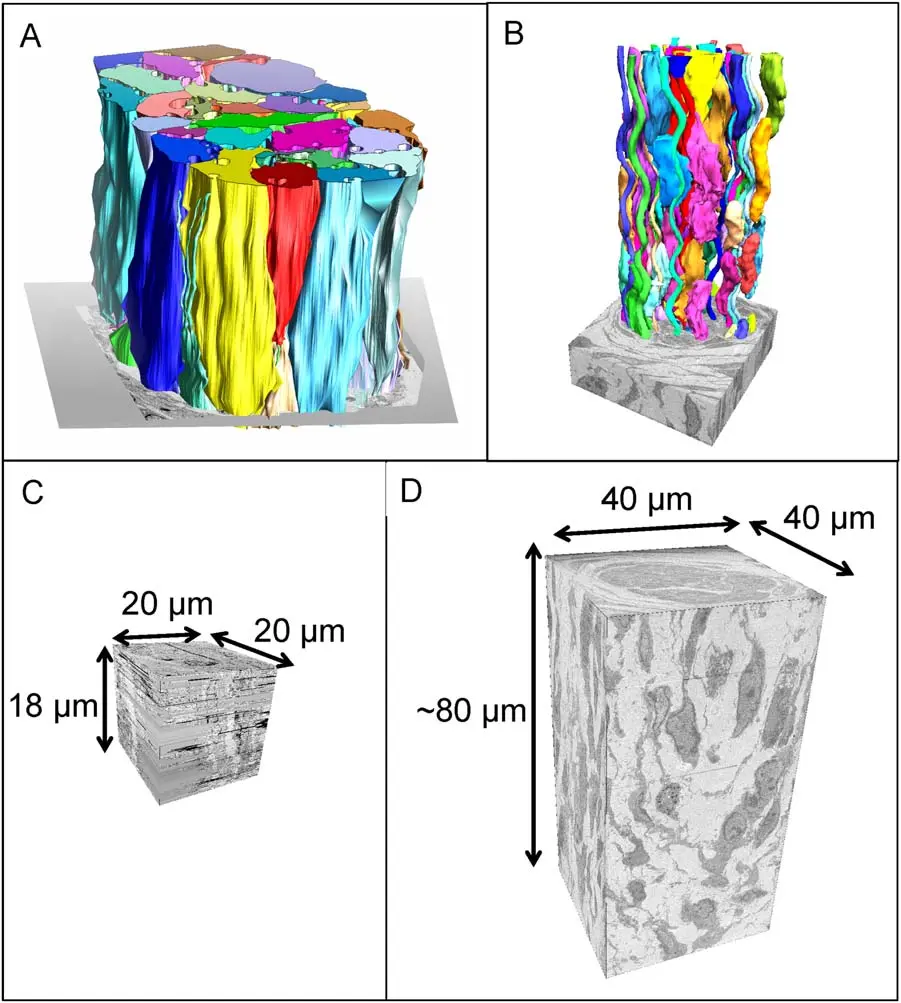
In a standard SBF-SEM workflow, an automated in-chamber ultramicrotome iteratively removes ultrathin sections from a resin-embedded sample, while a backscattered electron (BSE) detector captures the newly exposed block-face, generating isotropic or near-isotropic 3D datasets of massive tissue volumes [5, 22, 32]. By coupling SBF-SEM with confocal or super-resolution fluorescence microscopy, vCLEM enables the targeted 3D imaging of molecularly defined cells, sub-cellular organelles, or transient biological events within a volume of hundreds of thousands of cubic micrometres [3, 30, 92]. This targeted approach drastically increases the throughput of volume EM by guiding the electron beam specifically to regions of interest (ROIs) identified by light microscopy, circumventing the need for blind, time-consuming searches through vast ultrastructural datasets [3].
Pre-Embedding Labeling Strategies
Achieving reliable molecular contrast in SBF-SEM is uniquely challenging. Because the technique relies on backscattered electrons from the block-face rather than transmitted electrons through a section, specific proteins or organelles must be labeled with highly electron-dense materials that permeate the entire 3D volume prior to resin embedding [2, 176]. Pre-embedding labelling strategies are therefore critical for vCLEM, ensuring that the fluorescent signal corresponds to an ultrastructural marker that survives heavy metal contrasting and vacuum exposure [127, 183].
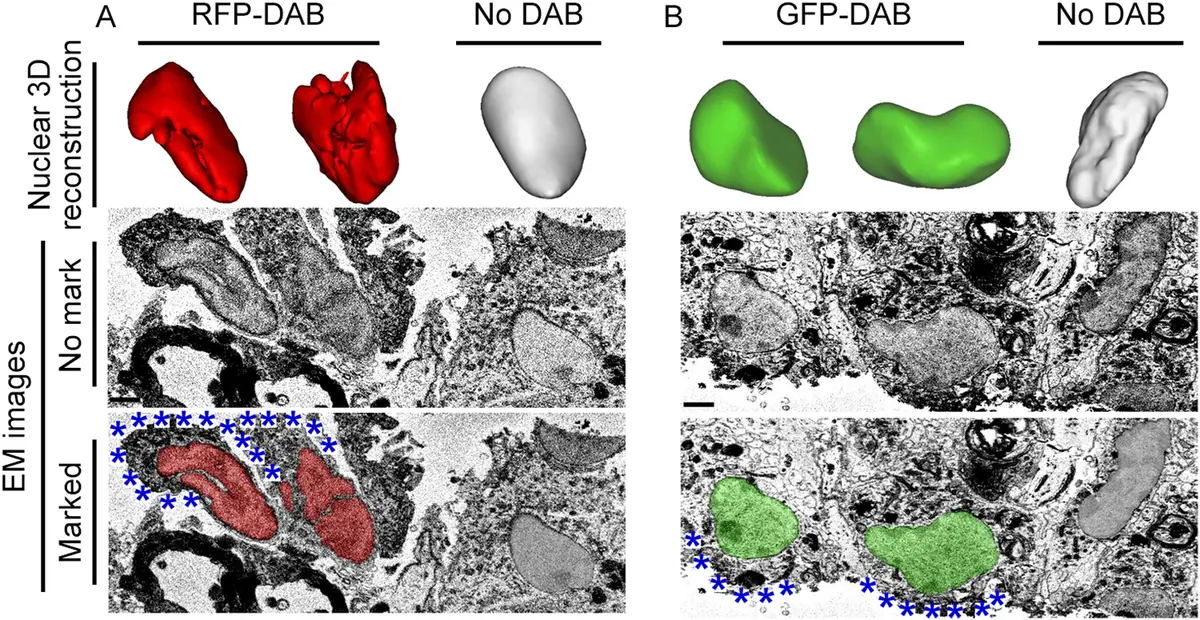
#### Genetically Encoded EM Tags and Peroxidases A major breakthrough in 3D CLEM has been the development of genetically encoded tags that generate electron-dense precipitates upon specific chemical reactions [182, 184]. Unlike traditional antibody-based immunolabelling—which suffers from poor tissue penetration and often requires destructive permeabilisation that degrades ultrastructural preservation—genetically encoded tags are expressed endogenously and require only the diffusion of small-molecule substrates [127, 176].
Historically, horseradish peroxidase (HRP) was utilised as a genetic label, converting diaminobenzidine (DAB) into an osmiophilic polymer in the presence of hydrogen peroxide. However, HRP is limited by its requirement for tetramerisation, glycosylation, and high calcium concentrations, rendering it largely non-functional when expressed in the reducing environment of the cytosol [182]. To overcome these limitations, engineered peroxidases such as APEX (ascorbate peroxidase) and its enhanced derivative APEX2 were developed [9, 184]. APEX2 is highly active in both cytosolic and luminal compartments. Following live-cell fluorescence imaging of an APEX2-tagged fusion protein, the sample is fixed and treated with DAB and hydrogen peroxide. APEX2 catalyses the local polymerisation of DAB, which subsequently binds heavy metals during osmium tetroxide post-fixation, yielding a highly electron-dense, localized precipitate clearly visible in SBF-SEM datasets [9, 184].
#### Photooxidation of Fluorescent Proteins and miniSOG An alternative and highly effective pre-embedding strategy relies on the photooxidation of DAB mediated by reactive oxygen species (ROS). While conventional fluorescent proteins like GFP can mediate DAB photooxidation, their singlet oxygen quantum yield is extremely low because the internal chromophore is shielded by a beta-barrel structure [182]. To address this, the "miniSOG" (mini Singlet Oxygen Generator) tag was engineered from the LOV (light, oxygen, and voltage) domain of *Arabidopsis* phototropin 2 [182]. MiniSOG is a small, 106-amino-acid fluorescent flavoprotein that requires no exogenous cofactors other than ubiquitous flavin mononucleotide (FMN) [182].
In a miniSOG-vCLEM workflow, live cells or tissues expressing the miniSOG fusion protein are first imaged using standard fluorescence or confocal microscopy. The sample is then fixed, immersed in a DAB solution, and illuminated with intense blue light while oxygen is continuously supplied [182]. The illumination excites miniSOG, generating a robust yield of singlet oxygen that locally polymerises DAB. The reaction is monitored under transmitted light until a faint brown precipitate appears, after which the sample is heavily osmicated [182, 187]. The resulting osmiophilic polymer provides exquisite, highly localized contrast for SBF-SEM, enabling the 3D reconstruction of specific macromolecular complexes without compromising the preservation of surrounding cellular landmarks [176, 182].
#### Nanogold and Pre-embedding Volumetric IEM For endogenous targets where genetic tagging is not feasible, pre-embedding volumetric immuno-electron microscopy (vIEM) utilizing ultra-small gold particles presents a viable alternative [127]. Standard immunogold particles (e.g., 10-15 nm) are too large to penetrate deep into well-fixed tissues, restricting their utility in volume EM [184]. Instead, ultra-small nanogold probes (approximately 1.4 nm in diameter) conjugated to primary or secondary antibodies can penetrate deep into tissue volumes [127]. Once the nanogold has bound to the target, a silver or gold enhancement step is applied, nucleating heavy metals around the 1.4 nm core until the particle grows to a size readily detectable by the BSE detector in an SBF-SEM [127]. Furthermore, when these probes are densely packed, the heavy metal deposits act as an intrinsic conductive network that significantly reduces charging artifacts during the SBF-SEM slicing and imaging process, thereby preserving image resolution [127].
Post-Embedding Approaches and In-Resin Fluorescence (IRF)
While pre-embedding labels generate artificial electron-dense precipitates, post-embedding CLEM aims to preserve the endogenous fluorescence of the sample directly within the resin block, permitting correlation to occur *after* the sample has been embedded [142]. This approach drastically simplifies registration, as the sample is physically locked in its final geometry, preventing the anisotropic shrinkage and structural distortions that typically plague sample preparation between LM and EM steps [140].
However, preserving fluorescence in a state compatible with SBF-SEM is exceptionally challenging. SBF-SEM requires heavy metal *en bloc* staining (such as the ROTO protocol: osmium-thiocarbohydrazide-osmium) to provide BSE contrast and electrical conductivity [8, 34]. Unfortunately, osmium tetroxide strongly quenches fluorescence, while the heat polymerisation of hydrophobic epoxy resins dehydrates and denatures fluorescent proteins [34, 140].
To achieve In-Resin Fluorescence (IRF), researchers have developed delicate compromise protocols. One strategy involves omitting high concentrations of osmium and utilizing acrylic or methacrylate resins, such as Lowicryl HM20, which can be UV-polymerised at sub-zero temperatures following high-pressure freezing and freeze substitution [9, 140]. While this beautifully preserves fluorescent proteins for post-embedding LM [140], the resultant resin blocks are often too soft for the SBF-SEM diamond knife, tending to crumble and deposit debris onto the block-face [34]. Furthermore, the reduction of heavy metals severely diminishes BSE contrast and exacerbates charging, restricting the SBF-SEM resolution [34]. Consequently, researchers must carefully titrate osmium and uranyl acetate concentrations, or utilize specifically modified epoxy blends, to strike an optimal balance between the retention of an optical signal and the generation of a robust, conductive ultrastructural dataset [18, 140].
When IRF is successfully achieved, it enables the use of integrated light and scanning electron microscopes (ILSEM or iCLSM) [3]. In an integrated system, a confocal or widefield fluorescence microscope is built directly into the vacuum chamber of the SBF-SEM [3, 14]. The system seamlessly toggles between optical imaging of the block-face to locate the fluorescent ROI and electron beam scanning/microtome slicing [14, 142]. This completely eliminates the need to transfer the sample between standalone microscopes, maximizing the throughput and precision of block-face CLEM [3].
Fiducial Markers and 3D Registration
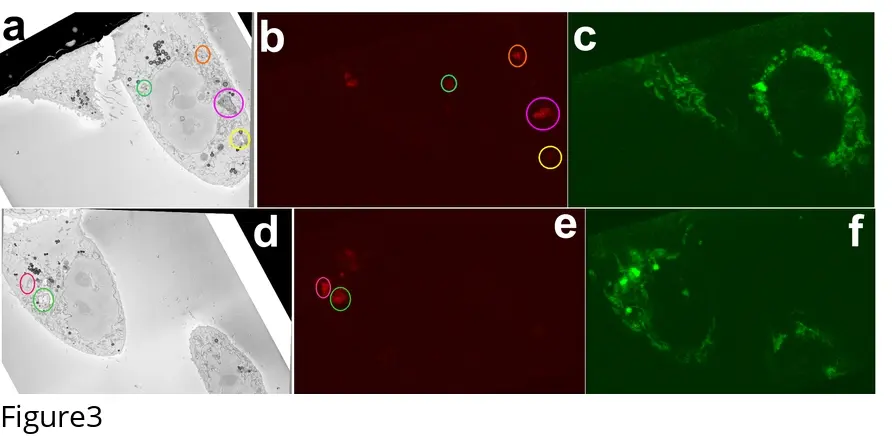
The cornerstone of any vCLEM experiment is the accurate superimposition of the optical and ultrastructural datasets. In traditional 2D CLEM, correlating a single thin section is relatively straightforward. However, correlating a 3D confocal z-stack with an SBF-SEM image stack introduces significant complexities, primarily due to resolution mismatches (especially in the z-axis), rotational variations, and non-linear tissue distortions induced by dehydration and resin embedding [3, 140, 183].
To overcome these barriers and achieve sub-100 nm targeting accuracy, the coordinate planes of the light and electron microscopes must be anchored using shared reference points, or fiducial markers, that are visible in both modalities [3, 14, 183].
#### Bimodal Nanoparticles and Fluorescent Nanodiamonds Artificial bimodal fiducials are frequently introduced into the sample prior to imaging. Fluorescent nanodiamonds (FNDs) are highly stable, non-toxic, 35-nm carbon-based particles that can be endocytosed by living cells [183]. FNDs possess a non-blinking, far-red fluorescence emission that is completely immune to photobleaching and survives aggressive osmium staining and epoxy resin embedding [183]. Under the electron beam, the high-density carbon core of the FND produces a distinct BSE signature [3, 183]. By identifying the 3D coordinates of internalised FNDs in both the confocal z-stack and the subsequent SBF-SEM volume, researchers can generate a highly precise transformation matrix to align the functional fluorescence data (e.g., MitoTracker) seamlessly over the ultrastructural map [183].
#### Near-Infrared Branding (NIRB) For complex tissue samples such as brain slices, where introducing nanoparticles is impractical, Near-Infrared Branding (NIRB) is commonly employed [50]. After the tissue is imaged via two-photon or confocal microscopy, the user increases the laser power to burn distinct, microscopic fiducial marks directly into the fixed tissue around the specific ROI [50]. These laser-induced lesions survive resin embedding and appear as dark, unambiguous structural voids in the SBF-SEM images. The NIRB marks serve as a 3D bounding box, allowing the microscopist to trim the block precisely and align the pre-embedding fluorescence data with the final electron tomogram [50].
#### Endogenous Biological Landmarks In label-free or marker-less registration, researchers rely exclusively on endogenous morphological features [138, 185]. In thick tissues, the architecture of the microvasculature, the distinct shapes of specific nuclei, or specific cell body distributions are mapped in 3D using light microscopy (e.g., photooxidation of the DNA-binding dye DRAQ5) [138, 184, 186]. The unique geometrical constellation of these biological landmarks is then relocated in the low-magnification SBF-SEM overview scans, enabling the operator to "home in" on the target area [34, 185].
Once the data is acquired, sophisticated computational tools are required for final alignment. Advanced image processing software such as Amira, Icy (with the eC-CLEM plugin), and specific point-cloud-based registration algorithms (e.g., CLEM-Reg) utilise mathematical models like random sample consensus (RANSAC) to correct for isotropic scaling, rotation, and shear deformations, accurately warping the fluorescence data over the SBF-SEM coordinates [124, 178, 183].
Practical CLEM Workflows: From Live-Cell to Targeted SBF-SEM
Executing a successful vCLEM study using SBF-SEM requires a meticulously orchestrated workflow that transitions the sample from a living, dynamic state into a heavily contrasted, solid plastic block without losing the spatial coordinates of the target [3, 26]. The workflow typically follows five distinct phases:
1. **Live-Cell Functional Imaging:** Cells cultured on gridded, coordinate-mapped coverslips (often containing artificial fiducials) are observed under a live-cell confocal microscope [3]. Researchers track dynamic events—such as the motility of endo-lysosomes or transient fusion events—capturing high-speed temporal data [3]. 2. **In Situ Fixation:** The moment a rare biological event is optically identified, a primary fixative (glutaraldehyde/paraformaldehyde) is rapidly perfused directly into the culture medium while the camera continues acquiring [3]. This instantly arrests the cellular machinery, locking the dynamic event in its exact spatial position [3]. A final, high-resolution z-stack of the fixed cells and surrounding fiducials is acquired [3]. 3. **Contrasting and Resin Embedding:** The sample undergoes heavy metal *en bloc* staining. If photooxidation or APEX labelling is utilized, the DAB reaction is performed at this stage [186, 187]. The sample is then dehydrated through a graded ethanol series and embedded in a hard epoxy resin (e.g., Durcupan or Epon) formulated with conductive additives like Ketjenblack to mitigate SBF-SEM charging [4]. 4. **Relocation and Trimming:** The resin block is mounted on a microtome pin. Using the coordinate grid or NIRB marks, the block is mechanically trimmed down to a microscopic mesa containing only the ROI, ensuring the target sits directly at the block-face [50, 92, 138]. 5. **Targeted SBF-SEM Acquisition:** The trimmed block is transferred to the SBF-SEM chamber. By overlaying the LM map with low-magnification EM overview images, the user "gates" the field of view specifically around the target cell or organelle [83]. The SBF-SEM then initiates its automated slice-and-view cycle, slicing 25–50 nm sections and scanning only the selected ROI [32, 50]. This targeted approach prevents the machine from wasting days scanning irrelevant resin, reducing acquisition time from weeks to mere hours, and generating a highly localized, high-resolution 3D dataset directly linked to the live-cell movie [3].
Applications of CLEM+SBF-SEM in Biology
The integration of correlative light and volume electron microscopy has unlocked unprecedented avenues of investigation across the life sciences, uniquely empowering researchers to locate needle-in-a-haystack molecular events within vast tissue landscapes [3, 5, 30].
#### Neuroscience and Connectomics In neuroscience, mapping the connectome requires not only tracing the wiring of axons and dendrites but also defining the molecular identity of synapses [176, 184]. SBF-SEM alone cannot distinguish whether a given synaptic vesicle pool is excitatory or inhibitory. By utilizing vCLEM, researchers have expressed the APEX2 or miniSOG tag fused to VGLUT2 (Vesicular Glutamate Transporter 2) in specific neuronal populations [176, 187]. Following photooxidation and SBF-SEM imaging, the glutamatergic vesicles exhibit an intensely dark, osmiophilic core [176, 187]. This allows neuroscientists to definitively map excitatory networks and observe the ultrastructural architecture of molecularly defined synapses within large tissue volumes [176]. Furthermore, CLEM workflows combining super-resolution confocal imaging (SuperCLEM) with SBF-SEM have been utilized to study structural plasticity, mapping nodes of Ranvier and myelinating glia-axon interactions in deep 3D space [83, 86].
#### Cell Biology and Organelle Interactions At the subcellular level, vCLEM has revolutionized the study of organelle contact sites and biogenesis. For example, the biogenesis of Weibel-Palade bodies (WPBs) at the Golgi apparatus involves complex tubulation events that are difficult to find using random TEM sectioning. By using fluorescence to identify cells actively forming WPBs, researchers can target SBF-SEM specifically to the active Golgi networks, allowing 3D volumetric reconstruction of the budding tubules [30].
Similarly, targeted vCLEM has been utilized to study transient membrane contact sites (MCS) between the endoplasmic reticulum (ER) and lysosomes [3]. By tracking active lysosomes with fluorescent probes in live cells, researchers identified rare, transient moments of multi-organelle tethering [3]. Fast *in situ* fixation and subsequent SBF-SEM allowed for the high-throughput 3D reconstruction of the ER-lysosome interfaces, proving that extensive ER contacts mechanically restrict lysosome motility [3].
#### Developmental Biology and Tissue Architecture In developmental biology, vCLEM has been instrumental in capturing transient developmental steps, such as angiogenesis in zebrafish embryos. Using transgenic models where endothelial cells express GFP, live-cell video microscopy can capture the exact moment two filopodia meet to fuse a new blood vessel (anastomosis) [92]. Because this fusion event is a transient structure measuring only ~3 within a whole organism of ~12.6 million , finding it blindly in an EM is virtually impossible [92]. By applying correlative 3D maps, researchers can precisely target the SBF-SEM to the fusion site, revealing the ultrastructural mechanism of lumen formation *in vivo* [92].
Challenges and Future Perspectives
Despite its massive potential, integrating CLEM with SBF-SEM poses several persistent technical challenges.
A primary constraint is the inherent conflict between preserving fluorescence and generating high-contrast EM data [34, 140]. Optimal ultrastructural preservation and BSE signal generation require heavy metal contrasting agents (osmium, uranyl acetate) and harsh dehydration protocols that intrinsically quench fluorescent proteins and limit antigenicity [34, 140, 176]. Consequently, optimizing the balance between preserving an optical signal for post-embedding targeting and maintaining sufficient ultrastructural contrast remains a delicate, sample-specific compromise [18, 140].
Registration accuracy is also hindered by the z-axis resolution mismatch [183]. While modern super-resolution LM can achieve lateral (x-y) resolutions below 50 nm, the axial (z) resolution of light microscopy is typically limited to several hundred nanometres [46, 183]. Conversely, SBF-SEM physical slice thicknesses are typically bounded at 25–50 nm [14, 25]. This discrepancy forces researchers to extrapolate the exact depth of a target within the block, often requiring digital multiplanar re-sectioning to properly align the two modalities [183]. Advanced techniques such as multi-energy deconvolution—which extracts sub-slice information by varying the SEM primary beam energy—are beginning to push SBF-SEM z-resolutions toward isotropy, which will drastically improve correlation confidence [14, 25, 32, 42].
Finally, while targeted CLEM improves the throughput of vEM by localizing the ROI [3], the SBF-SEM imaging process itself remains a bottleneck for large biological networks. Emerging AI-guided acquisition workflows, such as "Adaptive Scanning", seek to integrate dynamic-resolution algorithms into the CLEM pipeline. In these setups, low-resolution block-face scans are evaluated by an AI model in real-time, which then generates a targeted mask to autonomously drive high-resolution electron beam scanning exclusively over the areas containing the pre-identified fluorescent structures [117].
In conclusion, the convergence of light microscopy's molecular specificity with the unprecedented 3D ultrastructural capabilities of Serial Block-Face SEM marks a paradigm shift in structural biology. By utilizing advanced genetically encoded probes, high-fidelity fiducial markers, and precise correlative workflows, vCLEM empowers researchers to transcend the limitations of singular imaging modalities, directly linking dynamic biological function to its underlying nanoscale architecture.
***