How SBF-SEM Works: Principles of Operation
Introduction to SBF-SEM Operations
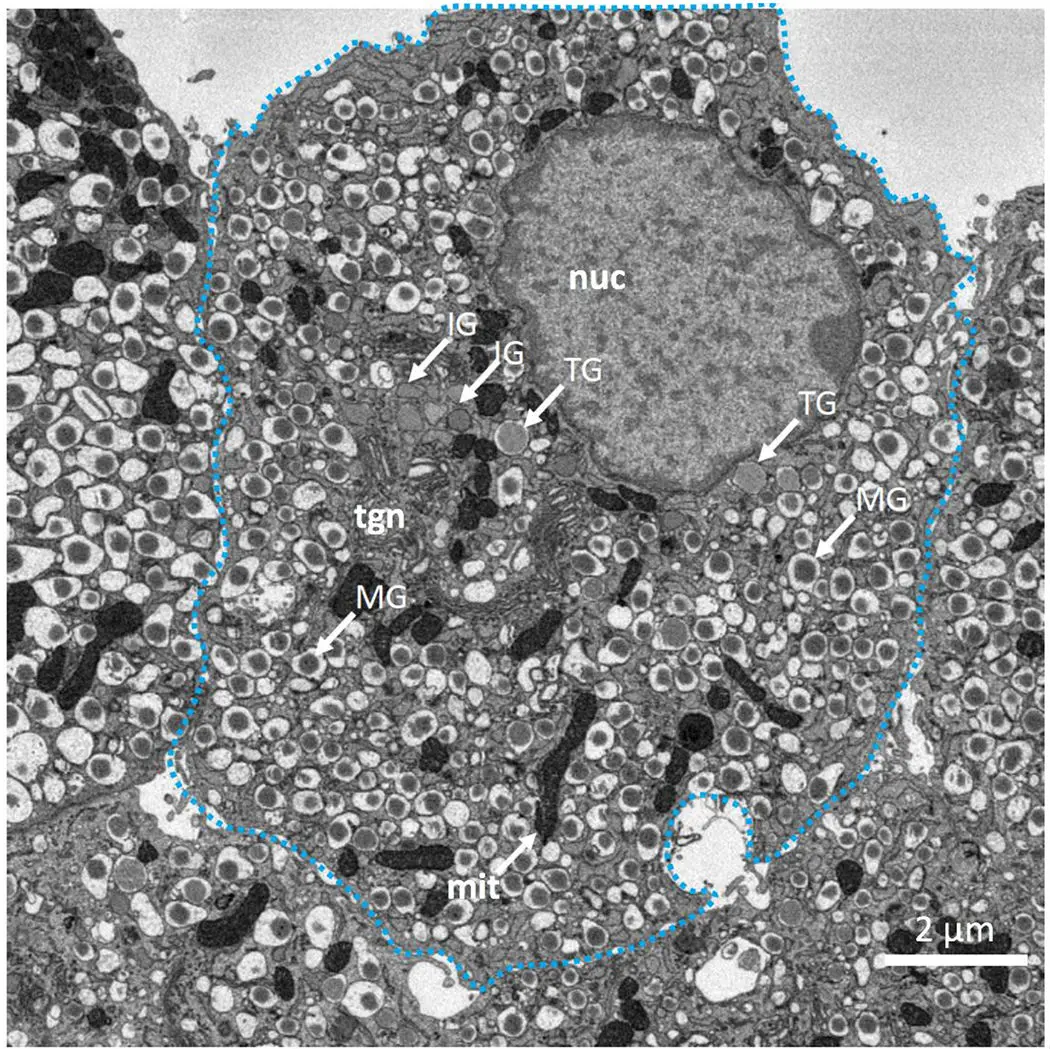
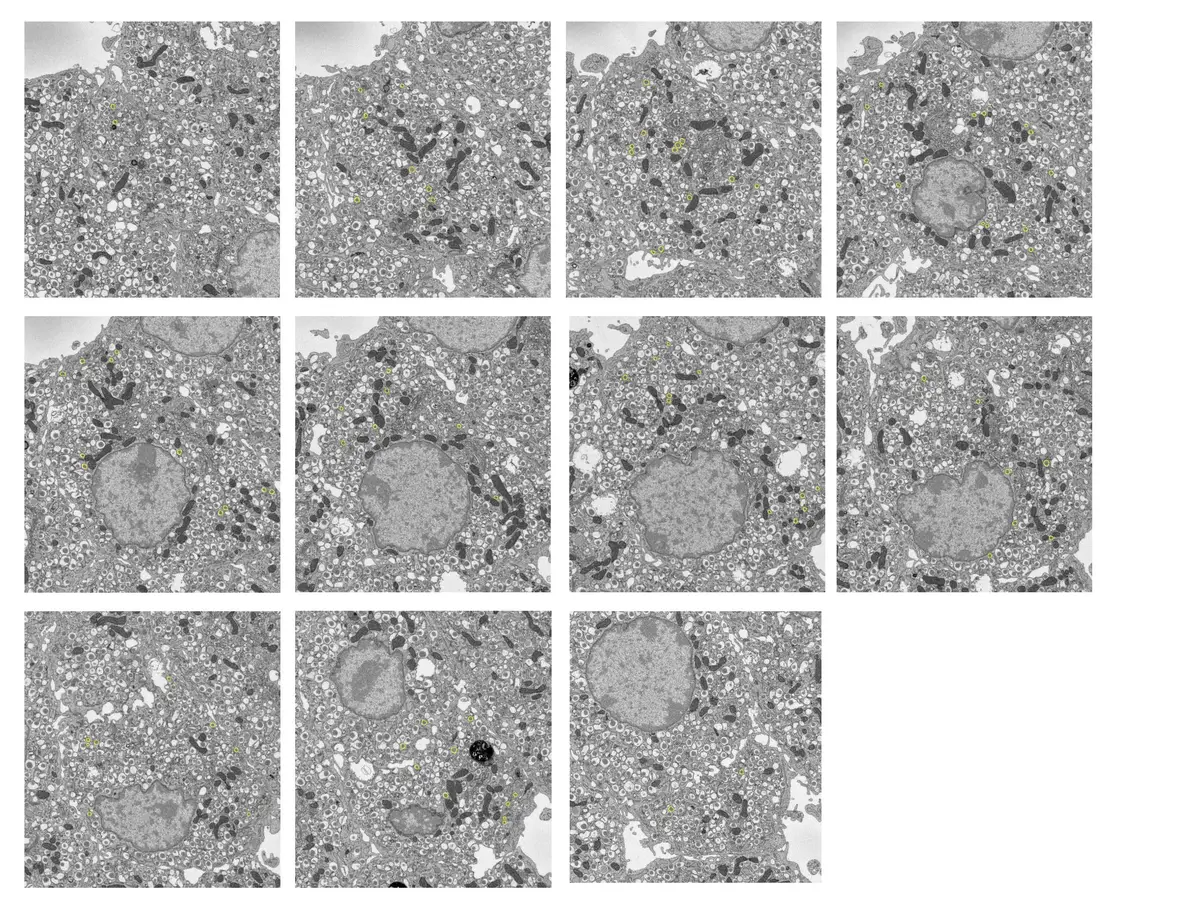
Serial Block-Face Scanning Electron Microscopy (SBF-SEM) is a highly automated, destructive volume electron microscopy (vEM) technique designed to capture the three-dimensional (3D) ultrastructure of biological tissues and materials at nanoscale resolution [32, 37, 42, 53]. The fundamental premise of SBF-SEM involves situating a miniature ultramicrotome directly inside the vacuum chamber of a scanning electron microscope (SEM) [18, 25, 26, 74]. This configuration enables an uninterrupted cycle wherein a thin section of a resin-embedded specimen is mechanically removed, and the freshly exposed block face is immediately imaged using a backscattered electron (BSE) detector [22, 25, 53, 54] (Figures 6–10).
The conceptual foundation of SBF-SEM was first introduced by S.B. Leighton in 1981, who successfully integrated a microtome within an SEM to cut and image a plastic-embedded squid nerve [12, 18, 20, 22, 26, 32, 34, 72]. However, Leighton's prototype was fundamentally constrained by the computing power of the era and the limitations of conventional high-vacuum SEMs, which required specimens to be repeatedly removed from the chamber for carbon coating to mitigate electrical charging between cuts [12, 18, 20, 26]. The technique was successfully revitalised and refined in 2004 by Winfried Denk and Heinz Horstmann, who overcame these limitations by utilising an environmental SEM with a variable-pressure chamber, enabling the high-resolution imaging of uncoated, non-conductive block faces [12, 18, 20, 22, 26, 32, 34, 37, 63, 73, 74, 77]. Today, SBF-SEM is widely accessible through commercial platforms—such as the Gatan 3View, Thermo Fisher VolumeScope, and ConnectomX Katana—that can either be retrofitted to compatible SEMs or purchased as complete, integrated systems [1, 9, 17, 18, 19, 20, 22, 37].
The Automated Cut-and-Image Cycle
The operation of an SBF-SEM system relies on a continuous, fully automated "cut-and-image" loop [12, 22, 42, 53, 54]. Prior to insertion into the microscope, the sample must be rigidly embedded in a hard plastic or epoxy resin and trimmed into a small, flat-faced pyramid [8, 11, 22, 25, 28, 41, 58]. This specimen block is then mounted securely onto a metallic stub—typically an aluminium pin—using conductive silver epoxy or adhesive to ground the sample, and is often sputter-coated with a thin layer of gold, platinum, or palladium to further enhance surface conductivity [11, 12, 14, 18, 28, 32, 41, 49, 50, 52, 58, 59, 62, 64, 65, 66, 68].
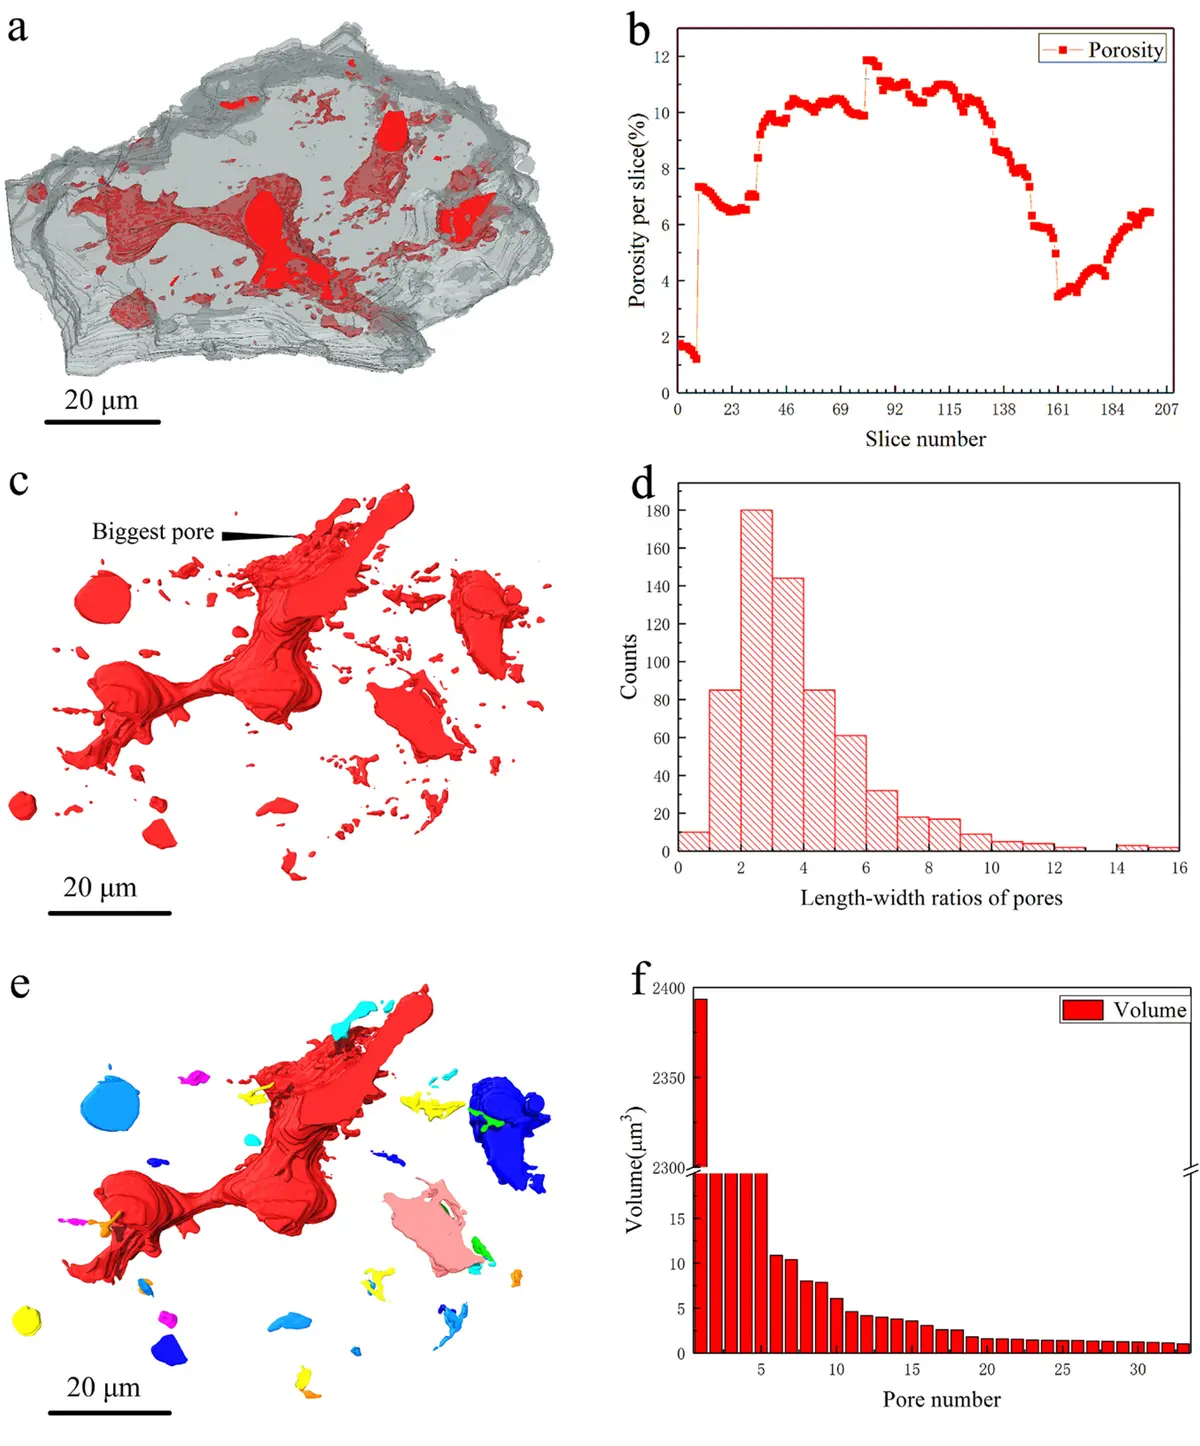
Once sealed inside the SEM chamber and aligned, the automated cycle commences. First, a highly focused, low-energy primary electron beam raster-scans the exposed surface of the specimen block [8, 12, 32, 72]. A BSE detector, typically positioned annularly just beneath the objective lens pole-piece, collects the scattered electrons to form a high-resolution, two-dimensional image of the block face [12, 22, 25, 32, 34, 42, 47, 53, 54, 55, 57]. Following image acquisition, the specimen stage is elevated along the z-axis by a precisely predefined increment—usually ranging from 15 to 200 nanometres [13, 18, 32, 34, 42, 56, 63].
Subsequently, a diamond knife, originally invented by Fernández-Morán in 1955 [18], is mechanically driven across the top of the specimen block, shearing off an ultrathin slice of the resin and exposing a virgin surface beneath [8, 18, 22, 25, 36, 42, 53, 54, 56, 60, 61, 73]. Crucially, the z-advance mechanism is achieved by raising the sample stage rather than lowering the knife, which ensures that the newly exposed block face remains at the exact same focal plane for the next imaging step, thereby eliminating the need for constant SEM refocusing and preventing thermal drift [13, 18]. In some modern iterations, a "stroke-up" control momentarily drops the sample during the knife's retraction phase to prevent accidental contact or scoring of the block face [18]. The cut sections, which are no longer required, are simply discarded as debris; they typically adhere to the back of the knife edge or are cleared away using a compressed air duster [18, 38, 76]. This iterative shaving and imaging cycle can run autonomously for days or weeks, compiling thousands of sequential micrographs that represent a massive 3D volume [12, 22, 32, 33, 36, 55, 63, 74].
Electron Beam Interactions and Signal Generation
Because the biological components within the resin lack inherent electron contrast and conductivity, the specimen must undergo rigorous en bloc staining with heavy metals—such as osmium, uranium, and lead—prior to embedding [8, 12, 14, 25, 32, 34, 42, 51, 77]. During the imaging phase, the primary electrons interacting with the specimen undergo elastic scattering events upon colliding with these heavy atomic nuclei, generating backscattered electrons [12, 13, 20, 22, 42, 51]. Because BSE yield is highly dependent on atomic number (Z), this phenomenon provides excellent compositional contrast, allowing heavily stained lipid membranes, proteins, and organelles to appear bright against the dark, low-Z carbon background of the embedding resin [2, 12, 20, 22, 41, 42]. By digitally inverting the contrast of these BSE micrographs, researchers can produce images that are remarkably similar in appearance to conventional transmission electron microscopy (TEM) [12, 13, 17, 33, 36, 42, 68].
Unlike secondary electrons (SE), which have very low energies (<50 eV) and can only escape from the uppermost few nanometres of the specimen surface, BSEs are highly energetic and can escape from deeper within the teardrop-shaped interaction volume [18, 20, 22, 51, 79]. Consequently, the accelerating voltage of the primary beam must be carefully calibrated in SBF-SEM. High accelerating voltages expand the interaction volume deep into the block, capturing signals from underlying layers and thereby degrading the axial (z) resolution [20, 42, 56]. To restrict signal generation purely to the uppermost surface layer, SBF-SEM typically operates at very low incident electron energies—usually between 1.0 keV and 3.0 keV [18, 32, 52, 55, 59, 62, 64, 65, 68, 72]. This ensures the BSE signal depth closely matches the physical thickness of the slice that will subsequently be removed [32, 51, 72].
Automation versus Manual Serial Sectioning
The advent of SBF-SEM represented a paradigm shift in volume electron microscopy, largely due to its automation and the elimination of manual section handling [1, 14, 20, 36, 56, 71, 74]. Traditionally, 3D ultrastructural reconstruction relied on serial section TEM (ssTEM), a highly skilled, laborious process where ultrathin sections are cut manually, floated on water, and collected onto fragile copper grids [1, 14, 33, 35, 38, 70, 71, 73, 74]. ssTEM is fraught with human error and mechanical artefacts; sections frequently suffer from compression, folding, chattering, or complete loss, leading to discontinuous datasets [14, 18, 35, 56, 70, 71, 73]. Furthermore, physically collected sections must be individually imaged and computationally aligned, a process that requires extensive deformation algorithms to correct rotational and physical distortions [14, 70, 73]. Array tomography, using systems like the Automated Tape-collecting Ultramicrotome (ATUM-SEM), automates section collection onto a continuous Kapton tape, preserving the sections for repeated imaging [9, 20, 22, 36, 72, 73, 80]. However, array tomography still suffers from the computational burden of aligning independently collected, often rotated, slices [22, 36, 73].
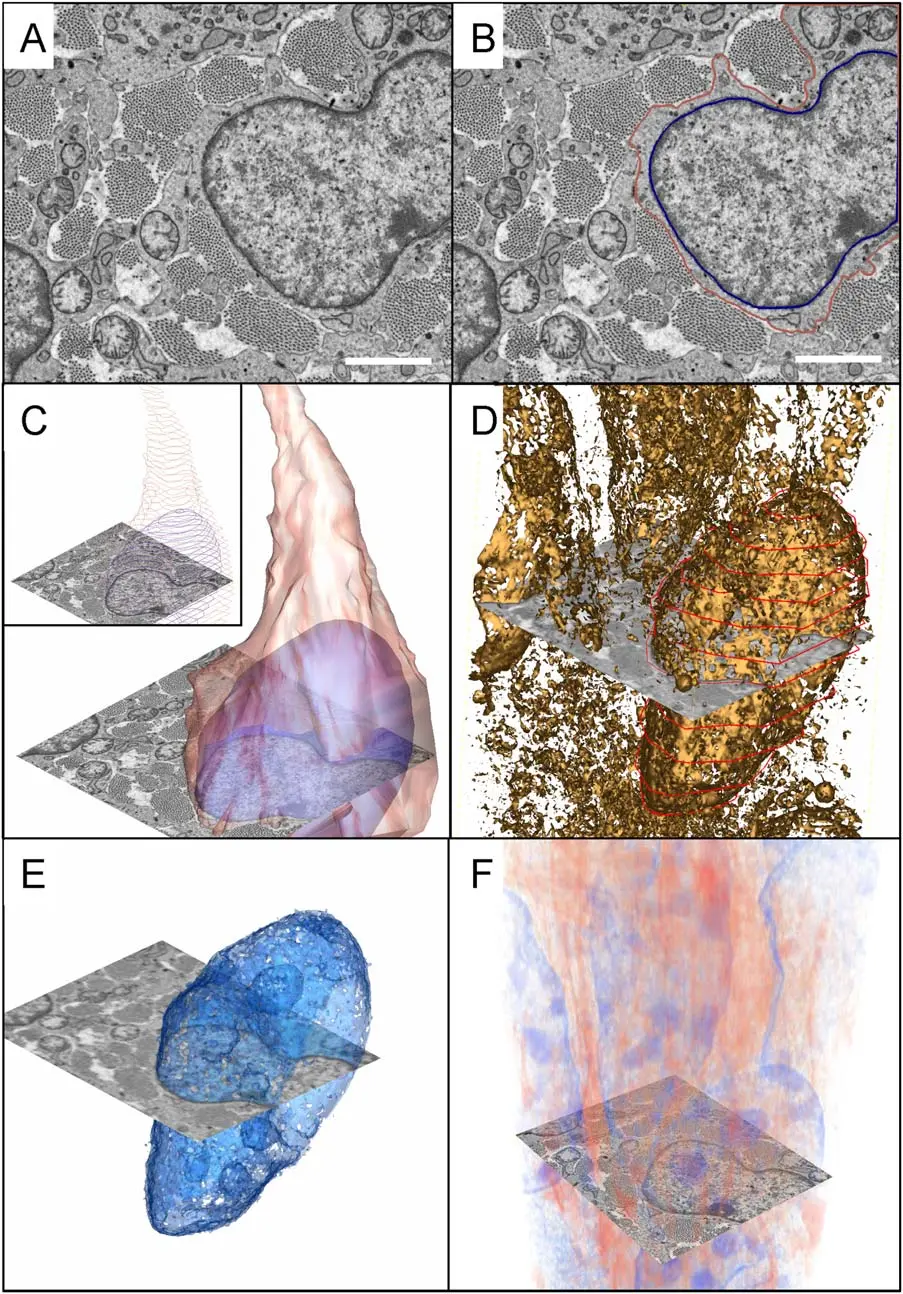
In stark contrast, SBF-SEM images the bulk block face directly before the section is removed [1, 8, 13, 14, 18, 20, 36, 56, 71]. Because the specimen remains securely mounted and stationary in the lateral (x-y) plane throughout the entire run, the resulting z-stack of images is inherently aligned [13, 14, 36, 41, 59, 71, 74]. While minor computational registration using translation models or rigid feature extraction (e.g., via Fiji or standard cross-correlation) is often applied to correct for slight sample drift or thermal expansion, complex non-linear deformation algorithms are largely unnecessary [9, 14, 28, 30, 36, 42, 55, 74]. Furthermore, any mechanical damage induced by the diamond knife—such as compression, stretching, or chatter—is generally confined to the discarded section, leaving the solid block face pristine for imaging [14, 18, 56].
This high degree of automation allows SBF-SEM to reconstruct exceptionally large fields of view and deep tissue volumes, routinely generating datasets up to cubic micrometres [26, 32, 42, 58, 61, 63]. While Focused Ion Beam SEM (FIB-SEM) is another prominent block-face technique that uses gallium ions rather than a diamond knife to mill away surface layers, it is an exceedingly slow process [20, 26, 28, 56, 63]. Thus, while FIB-SEM achieves superior isotropic resolution in small sample spaces (volumes ~), SBF-SEM is vastly faster and uniquely suited for large-scale connectomics and macro-architectural tissue studies [20, 26, 28, 32, 56, 61, 63]. The primary drawback of SBF-SEM compared to array tomography is that it is a destructive technique; once the block is sectioned and discarded, the specific imaging plane is permanently lost and cannot be revisited for higher magnification imaging or correlative light microscopy [13, 18, 56, 73, 74, 75, 78, 80].
Resolution Constraints and Physical Limits
The spatial resolution of SBF-SEM is intrinsically asymmetric, manifesting as non-isotropic voxels [18, 28]. In the lateral (x-y) plane, resolution is dictated by the diameter of the focused electron probe, the scattering dynamics within the resin, and the chosen pixel density, typically achieving 5 to 20 nanometres [25, 32, 42, 59, 63]. However, resolution along the axial (z) plane is physically constrained by the minimum section thickness that the ultramicrotome and diamond knife can reliably cleave without introducing severe artefacts [25, 28, 32, 42, 56, 63, 75]. For routine biological imaging, the slice thickness is generally set between 25 and 100 nm [25, 32, 38, 42, 55, 63, 70]. While specialised oscillating diamond knives and highly optimised resins have enabled slices as thin as 10 to 15 nm [34, 38, 56], pushing the microtome beyond its physical limits leads to uneven cutting, knife skipping, and alternating image brightness [13, 38].
Furthermore, spatial resolution and slice consistency are heavily dictated by the specimen's susceptibility to radiation damage [24, 32, 38, 51]. As the electron beam dwells on a specific pixel, energy is deposited into the plastic matrix [20, 38]. If the electron fluence exceeds a critical threshold—calculated to be approximately 20 electrons per square nanometre () for standard Epon or Durcupan resins—the block face undergoes rapid shrinkage, polymer degradation, and melting [32, 42]. This radiation-induced collapse of the block face disrupts the geometry of the subsequent cut, resulting in erratic sectioning, horizontal ripples, discontinuities in the resulting 3D volume, and an inability to maintain uniform slice thickness [24, 32, 38, 51]. Therefore, the dwell time, pixel size, and beam current must be meticulously balanced to maintain an optimal signal-to-noise ratio without compromising the physical integrity of the block face [32, 42].
Mitigating Sample Charging and Artefacts
Because embedding resins are highly effective electrical insulators, the bombardment of the specimen surface by the electron beam inevitably leads to the accumulation of negative charge [1, 11, 13, 18, 20, 36, 38, 55, 67]. Unmitigated charging repels the incident primary beam and severely distorts the trajectories of escaping backscattered electrons, leading to image blurring, spatial drift, intense signal blooming, and data corruption [13, 18, 20, 36, 38, 55, 67].
To combat this, manufacturers have integrated several compensatory mechanisms. The most common solution is the implementation of variable-pressure or low-vacuum SEM environments, wherein a controlled amount of gas (such as nitrogen or water vapour, at pressures between 5 and 100 Pa) is introduced into the specimen chamber [1, 13, 18, 20, 38, 47, 50, 55, 65, 66, 69]. As the primary electron beam traverses this gaseous environment, it ionises the gas molecules to form positive ions, which are subsequently attracted to the negatively charged specimen surface, neutralising the static buildup and allowing for uncoated imaging [13, 20, 38]. Additionally, localised focal charge compensation (FCC) devices can inject neutralising gas directly via a fine needle positioned fractions of a millimetre above the block face [5, 11, 52, 57]. These methods are often supplemented by robust pre-imaging sample preparation, ensuring the resin block is securely grounded to the aluminium pin with silver paste, and its non-cutting flanks are sputter-coated with highly conductive noble metals [11, 12, 14, 18, 28, 32, 41, 49, 50, 52, 58, 59, 62, 64, 65, 66, 68].
An advanced, hardware-driven approach to charge mitigation and resolution enhancement involves applying a negative bias potential directly to the specimen stage [9, 51]. In this setup, the primary electron beam is generated at a relatively high accelerating voltage (e.g., 2.5 to 3.0 kV) for optimal column stability, but encounters a strong decelerating electrostatic field (e.g., -1.5 kV) just before impacting the sample [51]. This deceleration drastically reduces the final landing energy of the primary electrons, strictly limiting their penetration depth to the uppermost 10 to 30 nm of the block face, which profoundly enhances z-axis specificity [51]. Concurrently, this same negative electric field forcibly re-accelerates the escaping BSEs upward toward the objective pole piece where the detector resides, amplifying the detector's signal capture by up to twenty-fold and drastically improving the image signal-to-noise ratio [51].
Innovations in Achieving Isotropic Resolution
While the physical constraints of ultramicrotomy limit the mechanical slice thickness to approximately 25 nm, recent computational and acquisition innovations have enabled SBF-SEM to breach this barrier, achieving true sub-slice, isotropic 3D spatial resolution [25, 32, 42].
The foremost technique is multi-energy (or dual primary energy) deconvolution [25, 32, 42]. In this approach, rather than capturing a single image per slice, the SEM acquires two or more sequential images of the stationary block face using different accelerating voltages—for instance, one at 1.0 keV and another at 1.4 keV [25, 42]. Because the penetration depth of the electron beam scales with its landing energy, the 1.0 keV probe captures a BSE signal originating almost exclusively from the top 13 nm of the block face, whereas the 1.4 keV probe penetrates deeper, capturing a composite signal from the top 25 nm [25, 42].
By utilising Monte Carlo simulations of electron scattering behaviour within the polymer and heavy-metal matrix, the varying depth contributions of each beam energy can be precisely modelled [25, 42]. Applying matrix inversion mathematics or blind deconvolution algorithms (such as the ThruSight method) to these overlapping datasets allows software to subtract the surface signal from the deeper composite signal [20, 25, 42]. Consequently, researchers can virtually reconstruct discrete 5-to-12.5 nm thick sub-slices contained entirely within the physical 25 nm resin slice [25, 42]. This elegant synthesis of physics-based modelling and automated microscopy enables SBF-SEM to produce highly isotropic data volumes (approaching ~5 nm in x, y, and z axes), bridging the resolution gap between rapid block-face sectioning and ultra-precise ion milling [25, 32, 42].